

Survival motor neuron protein deficiency impairs myotube formation by altering myogenic gene expression and focal adhesion dynamics
- PMID: 24760765
- PMCID: PMC4140458
- DOI: 10.1093/hmg/ddu189
Survival motor neuron protein deficiency impairs myotube formation by altering myogenic gene expression and focal adhesion dynamics
Abstract
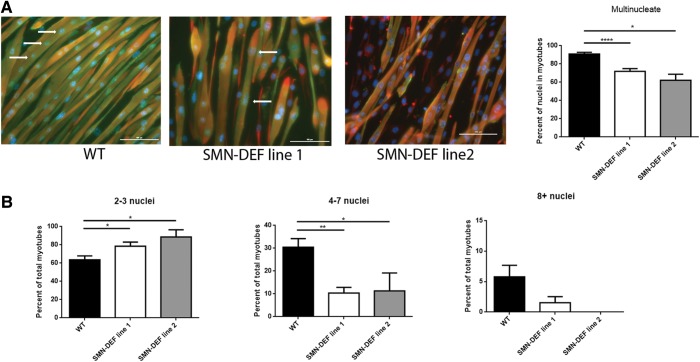
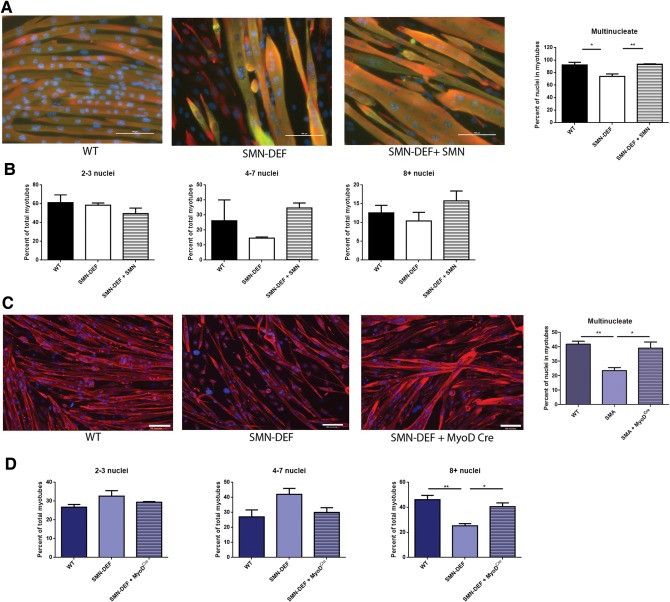
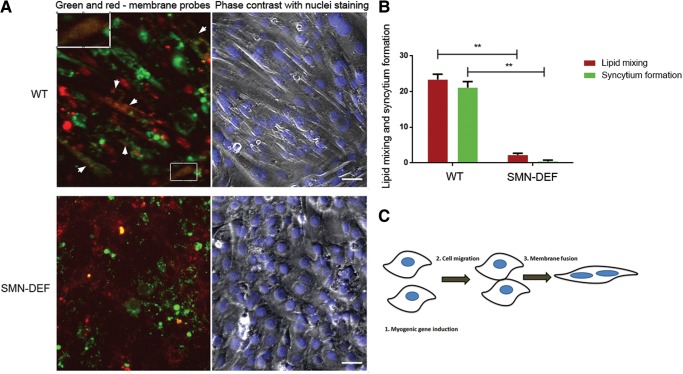
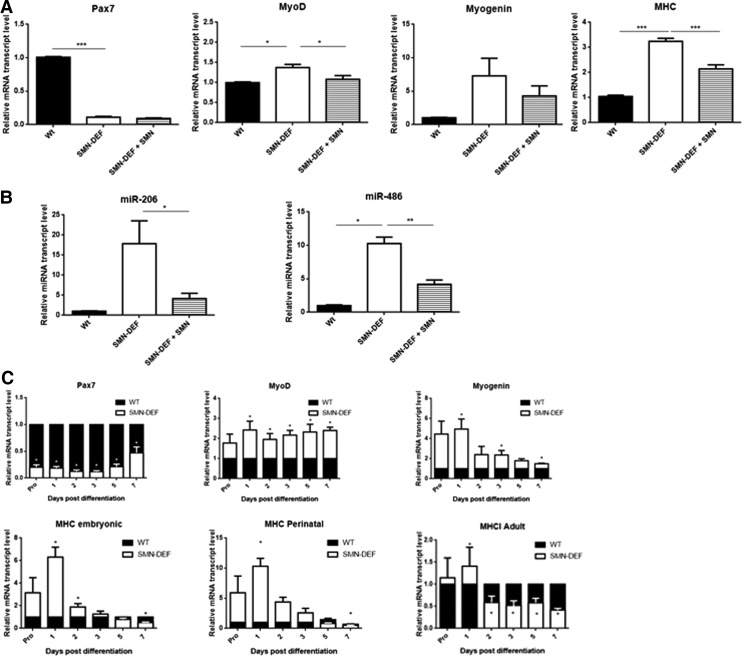
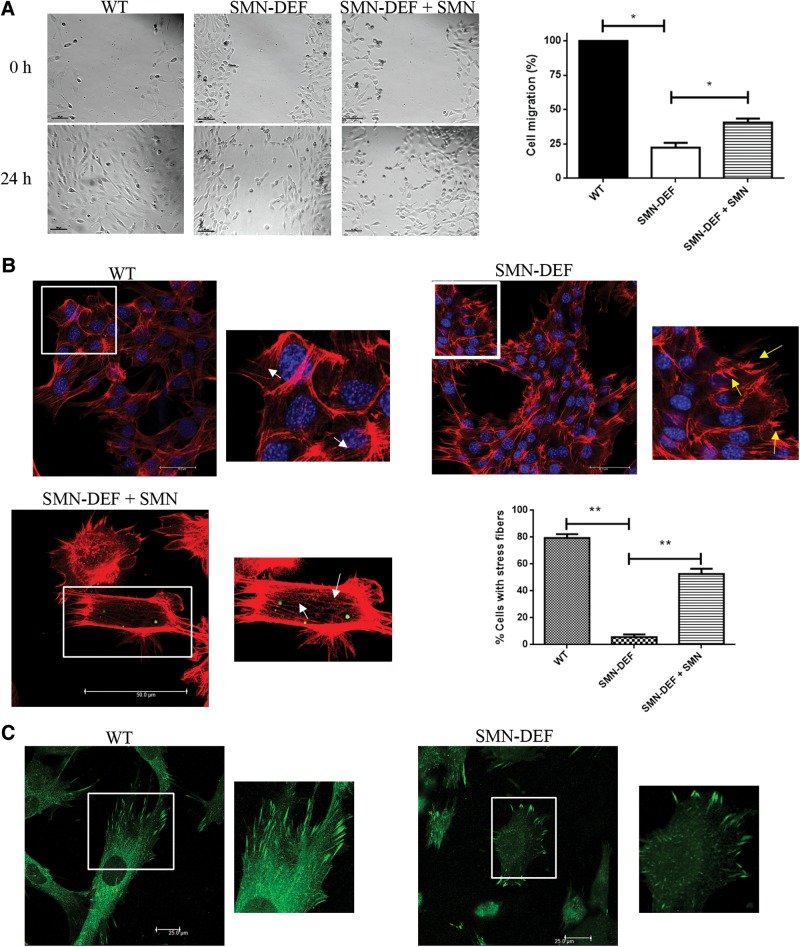
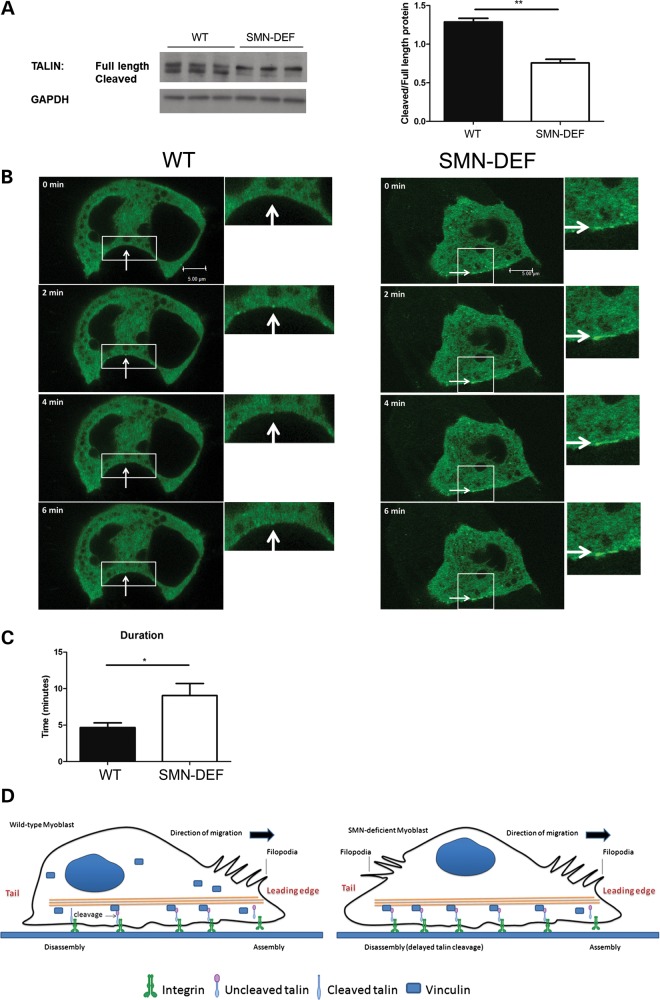
While spinal muscular atrophy (SMA) is characterized by motor neuron degeneration, it is unclear whether and how much survival motor neuron (SMN) protein deficiency in muscle contributes to the pathophysiology of the disease. There is increasing evidence from patients and SMA model organisms that SMN deficiency causes intrinsic muscle defects. Here we investigated the role of SMN in muscle development using muscle cell lines and primary myoblasts. Formation of multinucleate myotubes by SMN-deficient muscle cells is inhibited at a stage preceding plasma membrane fusion. We found increased expression and reduced induction of key muscle development factors, such as MyoD and myogenin, with differentiation of SMN-deficient cells. In addition, SMN-deficient muscle cells had impaired cell migration and altered organization of focal adhesions and the actin cytoskeleton. Partially restoring SMN inhibited the premature expression of muscle differentiation markers, corrected the cytoskeletal abnormalities and improved myoblast fusion. These findings are consistent with a role for SMN in myotube formation through effects on muscle differentiation and cell motility.
Published by Oxford University Press 2014. This work is written by (a) US Government employee(s) and is in the public domain in the US.
Figures
Similar articles
-
A cell-autonomous defect in skeletal muscle satellite cells expressing low levels of survival of motor neuron protein.Dev Biol. 2012 Aug 15;368(2):323-34. doi: 10.1016/j.ydbio.2012.05.037. Epub 2012 Jun 15. Dev Biol. 2012. PMID: 22705478 Free PMC article.
-
Survival motor neuron deficiency slows myoblast fusion through reduced myomaker and myomixer expression.J Cachexia Sarcopenia Muscle. 2021 Aug;12(4):1098-1116. doi: 10.1002/jcsm.12740. Epub 2021 Jun 11. J Cachexia Sarcopenia Muscle. 2021. PMID: 34115448 Free PMC article.
-
PKCθ signaling is required for myoblast fusion by regulating the expression of caveolin-3 and β1D integrin upstream focal adhesion kinase.Mol Biol Cell. 2011 Apr 15;22(8):1409-19. doi: 10.1091/mbc.E10-10-0821. Epub 2011 Feb 23. Mol Biol Cell. 2011. PMID: 21346196 Free PMC article.
-
Hypomorphic Smn knockdown C2C12 myoblasts reveal intrinsic defects in myoblast fusion and myotube morphology.Exp Cell Res. 2005 Nov 15;311(1):49-61. doi: 10.1016/j.yexcr.2005.08.019. Epub 2005 Oct 10. Exp Cell Res. 2005. PMID: 16219305
-
[Interactions of proliferation and differentiation signaling pathways in myogenesis].Postepy Hig Med Dosw (Online). 2014 May 8;68:516-26. doi: 10.5604/17322693.1101617. Postepy Hig Med Dosw (Online). 2014. PMID: 24864103 Review. Polish.
Cited by
-
Taldefgrobep Alfa and the Phase 3 RESILIENT Trial in Spinal Muscular Atrophy.Int J Mol Sci. 2024 Sep 24;25(19):10273. doi: 10.3390/ijms251910273. Int J Mol Sci. 2024. PMID: 39408601 Free PMC article. Review.
-
The Power of Human Protective Modifiers: PLS3 and CORO1C Unravel Impaired Endocytosis in Spinal Muscular Atrophy and Rescue SMA Phenotype.Am J Hum Genet. 2016 Sep 1;99(3):647-665. doi: 10.1016/j.ajhg.2016.07.014. Epub 2016 Aug 4. Am J Hum Genet. 2016. PMID: 27499521 Free PMC article.
-
Spinal muscular atrophy: from tissue specificity to therapeutic strategies.F1000Prime Rep. 2015 Jan 5;7:04. doi: 10.12703/P7-04. eCollection 2015. F1000Prime Rep. 2015. PMID: 25705387 Free PMC article. Review.
-
Central and peripheral delivered AAV9-SMN are both efficient but target different pathomechanisms in a mouse model of spinal muscular atrophy.Gene Ther. 2022 Sep;29(9):544-554. doi: 10.1038/s41434-022-00338-1. Epub 2022 Apr 25. Gene Ther. 2022. PMID: 35462564
-
Survival motor neuron protein deficiency alters microglia reactivity.Glia. 2022 Jul;70(7):1337-1358. doi: 10.1002/glia.24177. Epub 2022 Apr 4. Glia. 2022. PMID: 35373853 Free PMC article.
References
-
- Lefebvre S., Burglen L., Reboullet S., Clermont O., Burlet P., Viollet L., Benichou B., Cruaud C., Millasseau P., Zeviani M., et al. Identification and characterization of a spinal muscular atrophy-determining gene. Cell. 1995;80:155–165. - PubMed
-
- Shafey D., Cote P.D., Kothary R. Hypomorphic Smn knockdown C2C12 myoblasts reveal intrinsic defects in myoblast fusion and myotube morphology. Exp. Cell Res. 2005;311:49–61. - PubMed
Publication types
MeSH terms
Substances
Grants and funding
LinkOut - more resources
Full Text Sources
Other Literature Sources
Molecular Biology Databases
