. 2014 Jul 15;112(2):393-410.
doi: 10.1152/jn.00647.2013. Epub 2014 Apr 23.

The interplay of seven subthreshold conductances controls the resting membrane potential and the oscillatory behavior of thalamocortical neurons

Affiliations

The interplay of seven subthreshold conductances controls the resting membrane potential and the oscillatory behavior of thalamocortical neurons

Yimy Amarillo et al. J Neurophysiol. .

Abstract

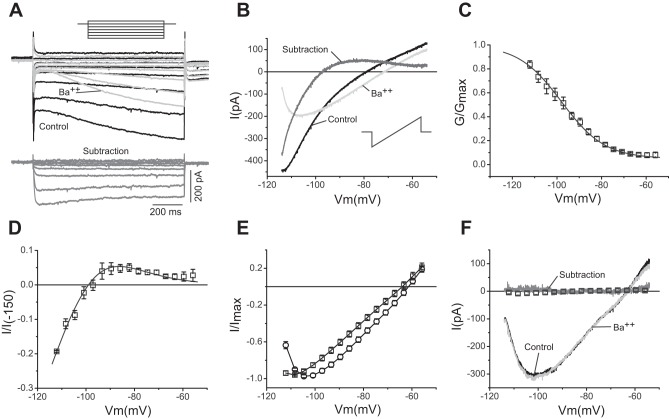
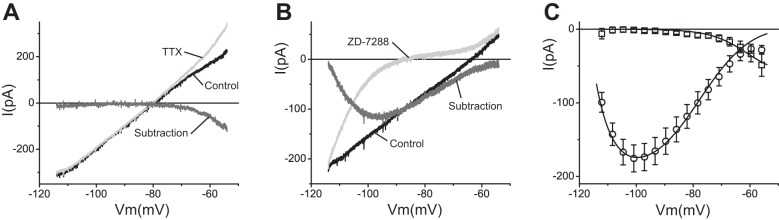
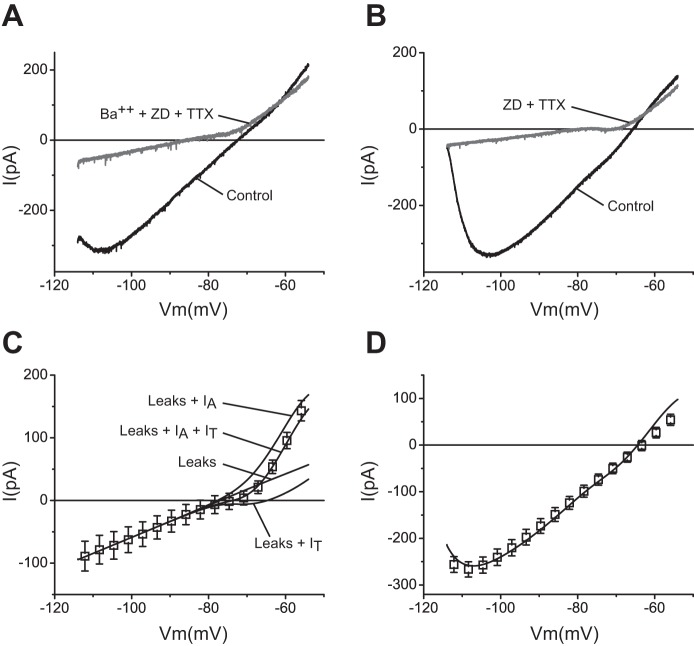
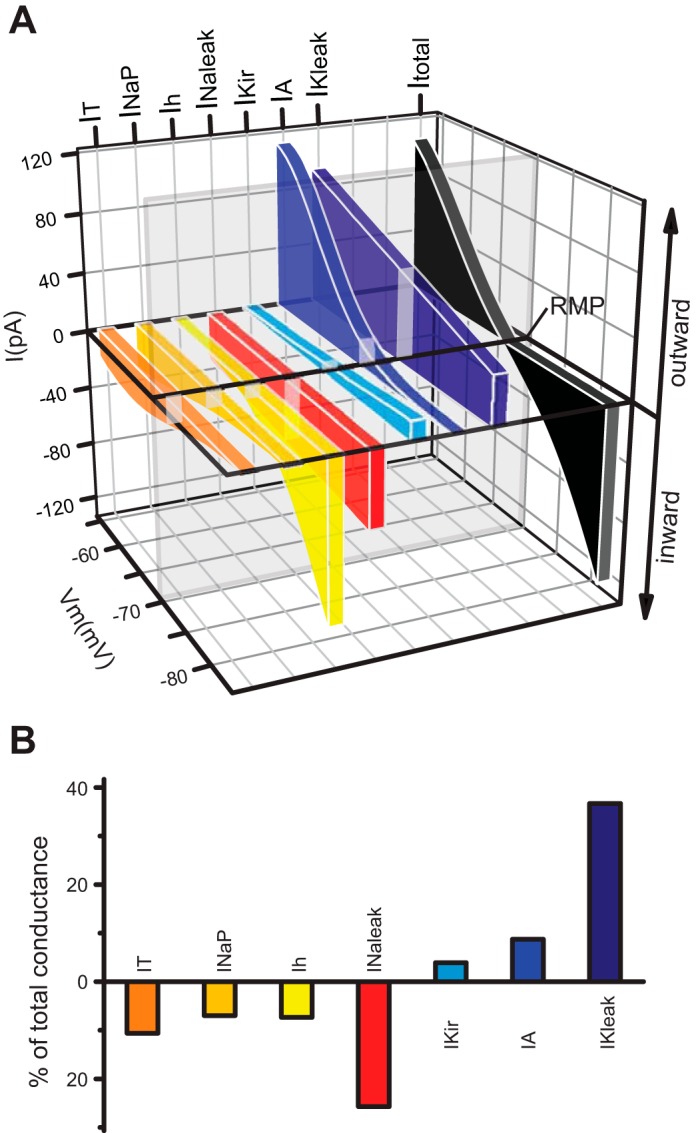
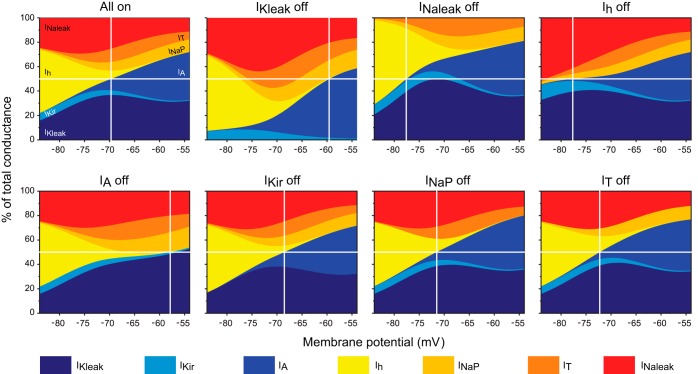
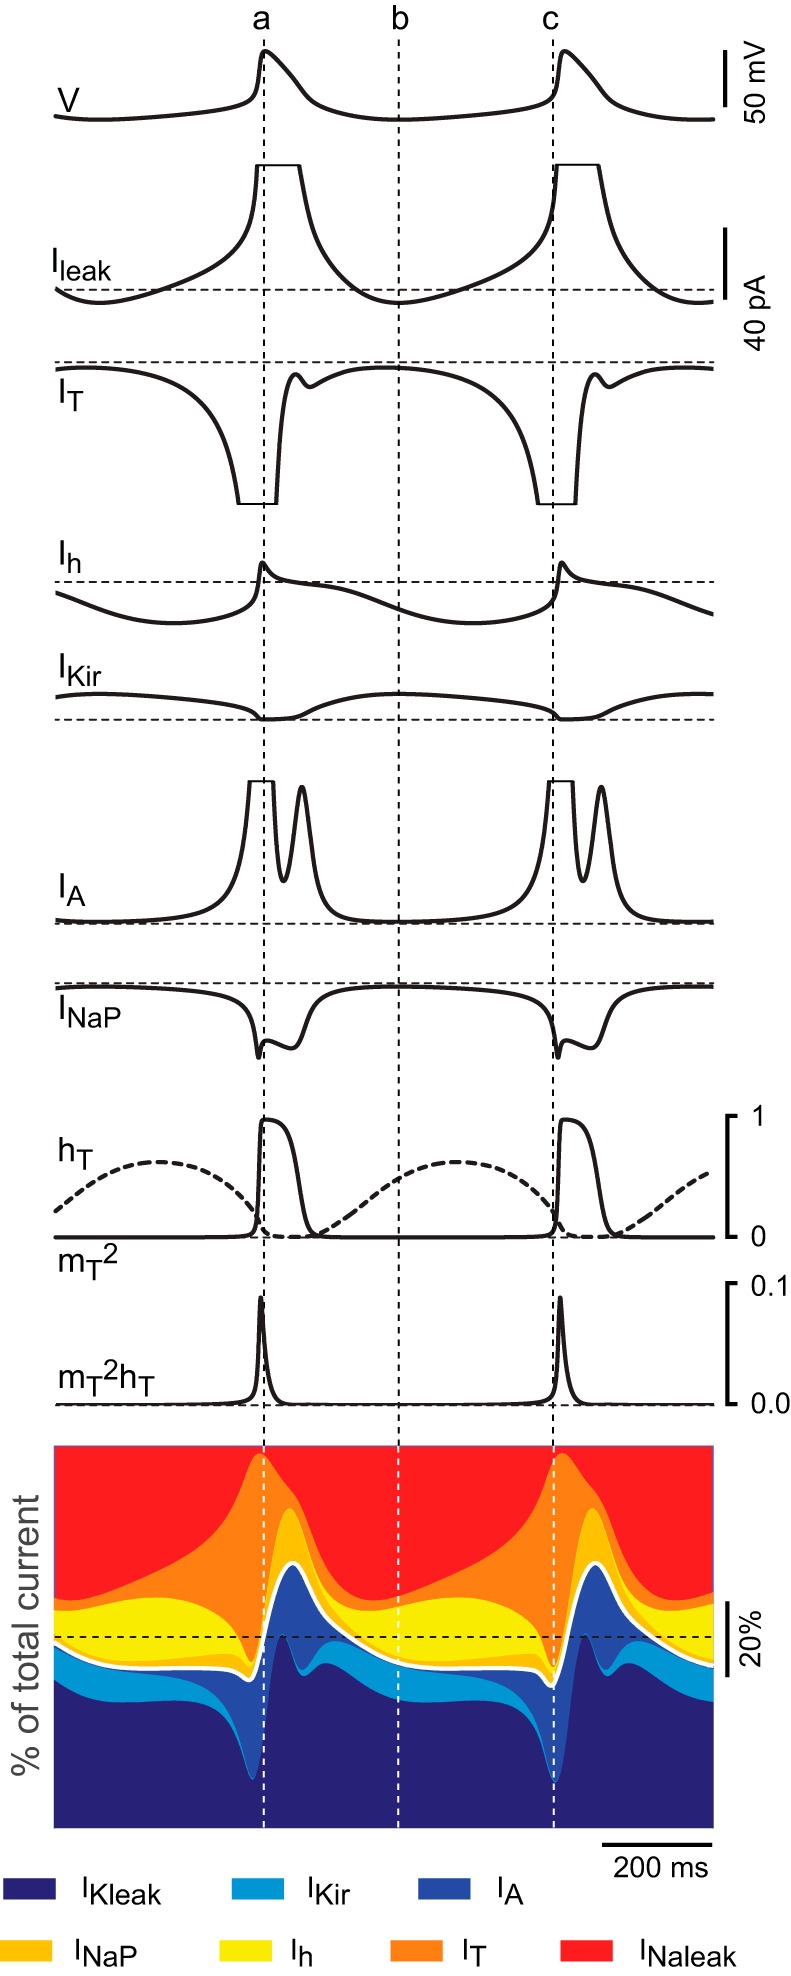
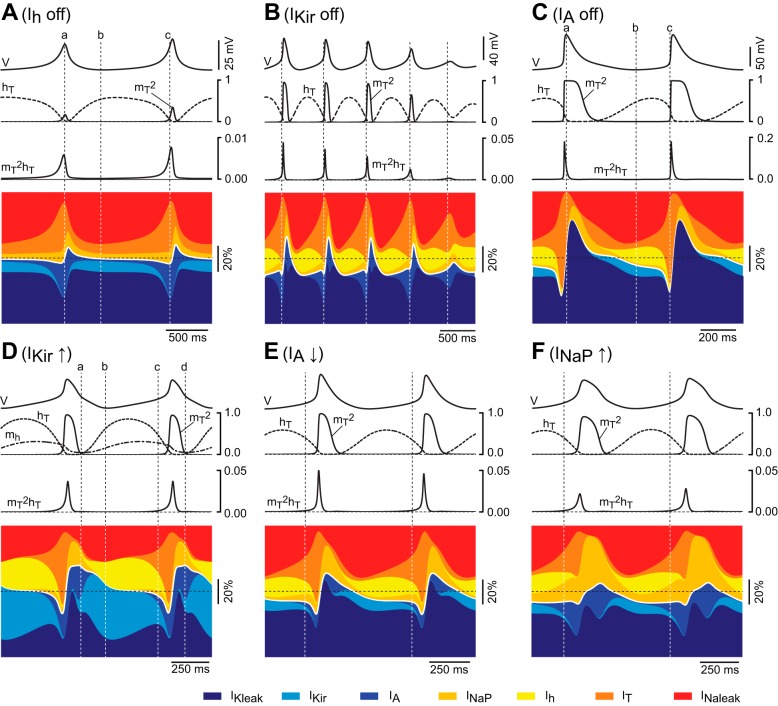
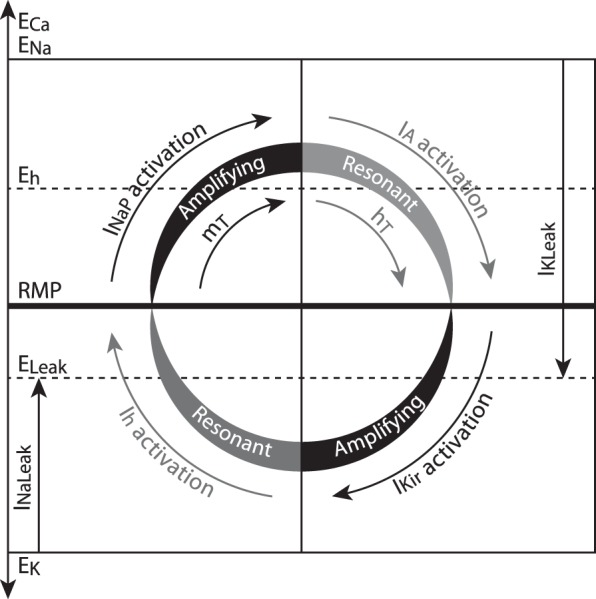
The signaling properties of thalamocortical (TC) neurons depend on the diversity of ion conductance mechanisms that underlie their rich membrane behavior at subthreshold potentials. Using patch-clamp recordings of TC neurons in brain slices from mice and a realistic conductance-based computational model, we characterized seven subthreshold ion currents of TC neurons and quantified their individual contributions to the total steady-state conductance at levels below tonic firing threshold. We then used the TC neuron model to show that the resting membrane potential results from the interplay of several inward and outward currents over a background provided by the potassium and sodium leak currents. The steady-state conductances of depolarizing Ih (hyperpolarization-activated cationic current), IT (low-threshold calcium current), and INaP (persistent sodium current) move the membrane potential away from the reversal potential of the leak conductances. This depolarization is counteracted in turn by the hyperpolarizing steady-state current of IA (fast transient A-type potassium current) and IKir (inwardly rectifying potassium current). Using the computational model, we have shown that single parameter variations compatible with physiological or pathological modulation promote burst firing periodicity. The balance between three amplifying variables (activation of IT, activation of INaP, and activation of IKir) and three recovering variables (inactivation of IT, activation of IA, and activation of Ih) determines the propensity, or lack thereof, of repetitive burst firing of TC neurons. We also have determined the specific roles that each of these variables have during the intrinsic oscillation.

Keywords: repetitive burst firing; resting membrane potential; subthreshold conductances; thalamocortical neuron.


Figures

Fig. 1.
Fig. 1.
Characterization of a strong inward rectifier potassium current (IKir) in thalamocortical (TC) neurons. A: voltage-clamp recordings before (black traces) and after (light gray traces) application of 50 μM Ba2+ (top). Bottom traces (dark gray) show the barium-sensitive component obtained by subtraction. The recordings were obtained using a protocol of square pulses from −124 to −64 mV in increments of 10 mV (inset) from a holding potential of −74 mV. B: barium experiment similar to that in A using a slow ramp from −114 to −54 mV (inset). Conventions as in A; Vm, membrane potential. C: normalized barium-sensitive conductance (G/Gmax) from 8 cells (average ± SE) obtained using the ramp protocol in B, with superimposed average Boltzmann fit (solid line). D: barium-sensitive current obtained with the ramp protocol from 8 cells (average ± SE) normalized to the extrapolated current at −150 mV (I/I−150; see methods). Superimposed (solid line) is the simulated current-voltage (I-V) curve obtained with a model using the parameters of the Boltzmann fit from C and Kir (average maximum conductance) = 2.0 × 10⁻⁵ S/cm2. E: normalized current (I/Imax; average ± SE) from wild-type (□; n = 24) and Kir2.2 knockout (KO) mouse TC neurons (○; n = 19) obtained with the ramp protocol in the absence of pharmacological agents. F: voltage-clamp recordings before and after application of 50 μM Ba2+ and barium-sensitive component obtained by subtraction from a Kir2.2 KO TC neuron. Conventions as in A and B. Superimposed (□) is the average ± SE (error bars are not visible) barium-sensitive component from 8 cells.
Fig. 2.
Fig. 2.
Pharmacological isolation of persistent sodium current (INaP) and hyperpolarization-activated cationic current (Ih) in TC neurons. A: voltage-clamp recordings obtained using the ramp protocol before (black trace) and after (light gray trace) application of 300 nM TTX. Dark gray trace is the TTX-sensitive component (INaP) obtained by subtraction. B: recordings before (black trace) and after (light gray trace) application of 10 μM ZD-7288. Dark gray trace is the ZD-7288-sensitive component (Ih) obtained by subtraction. C: TTX-sensitive component (□; average ± SE) and ZD-7288-sensitive component (○; average ± SE) from 5 and 9 cells, respectively. Superimposed (solid lines) are voltage-clamp ramp simulations obtained with the corresponding models using NaP = 5.5 × 10⁻⁶ S/cm2 and h = 2.2 × 10⁻⁵ S/cm2.
Fig. 3.
Fig. 3.
The simulated leak conductances and window current components of low-threshold calcium current (IT) and fast transient A-type potassium current (IA) recapitulate the remaining component after elimination of IKir, Ih, and INaP. A: voltage-clamp ramp recordings before (black trace) and after (gray trace) application of 50 μM Ba2+, 300 nM TTX, and 10 μM ZD-7288 to a wild-type TC neuron. B: voltage-clamp ramp recordings before (black trace) and after (gray trace) application of 300 nM TTX and 10 μM ZD-7288 to a Kir2.2 KO TC neuron. C: average values (symbols ± SE) from 10 Kir2.2 KO cells after application of TTX and ZD-7288 (remaining component). Solid lines are simulated I-V plots of the leaks (sodium and potassium), the leaks plus IT, the leaks plus IA, and the leaks plus IT and IA as indicated. Simulations were obtained with the corresponding models (see methods) using Kleak = 1.0 × 10⁻⁵ S/cm2, Naleak = 3.0 × 10⁻⁶ S/cm2, A = 5.5 × 10⁻³ S/cm2, and pT (maximum permeability) = 5.0 × 10⁻⁵ cm/s. D: average voltage-clamp ramp data (±SE) from 24 wild-type TC neurons in the absence of pharmacological agents. Solid line is a voltage-clamp ramp simulation using the model cell with all 7 subthreshold conductances turned on, using the same maximum conductances as in Figs. 1D, 2C, and 3C (default maximum conductances).
Fig. 4.
Fig. 4.
Subthreshold steady-state conductance of TC neurons. A: comparison of simulated steady-state I-V (Y and Z axes) plots of the subthreshold conductances obtained using the default maximum conductances at physiologically relevant potentials (−84 to −54 mV). The total steady-state I-V curve (black) corresponds to the algebraic sum of all 7 subthreshold conductances. The transecting vertical plane (glass) represents the resting membrane potential (RMP), at which the algebraic sum of inward (tones of red and yellow) and outward currents (tones of blue) is 0. B: contribution of the subthreshold conductances at RMP (see transecting plane in A) as a percentage of the total conductance (100%, of which 50% is the sum of inward current and the other 50% is the sum of outward current). Color conventions as in A.
Fig. 5.
Fig. 5.
Contribution of subthreshold conductances to the steady-state total conductance of TC neurons and establishment of RMP. Stacked area representations show the voltage-dependent contribution of the subthreshold conductances as nonoverlapping percentages of total conductance (sum of absolute current values at every voltage point is 100%). RMP (vertical lines; see Table 1) occurs at the membrane potential at which inward conductances (tones of red and yellow) equal outward conductances (tones of blue) at 50% (horizontal lines). Top right panel (All on) shows the contribution of all 7 conductances, whereas the other panels show the reconfiguration of the contributions after each of the subthreshold conductance is turned off one by one (as indicated above each panel).
Fig. 6.
Fig. 6.
The model reproduces the physiological behavior of TC neurons. A: current-clamp response of a TC neuron to injection of a depolarizing square pulse from a depolarized holding potential (top trace) and rebound response after release from a hyperpolarized holding potential (bottom trace). B: current-clamp responses of the model cell to protocols similar to that in A. The current-clamp responses of the model cell were obtained after incorporation of suprathreshold conductances (see text). Holding potentials and scales are the same for both TC neuron and model cell. Experimental recordings and simulations were performed at 32°C. C: current-clamp responses of the model cell to application of depolarizing subthreshold (top trace) and suprathreshold (bottom trace) square pulses after Kleak was increased to 150% of the default value (1.5 × 10⁻⁵ S/cm2). D: current-clamp responses of the model cell to application of current pulses of the same magnitude as in C after Kleak was decreased to 30% of the default value (3.0 × 10⁻⁶ S/cm2).
Fig. 7.
Fig. 7.
Single-parameter modifications enable repetitive burst firing in the murine TC neuron model. A: hyperpolarizing current injection (top trace) fails to elicit repetitive bursts (bottom voltage trace) when the model is set to the default parameters that reproduce the steady-state conductance of murine TC neurons. B–F: repetitive burst firing elicited by hyperpolarization after increase of pT from 5 × 10⁻⁵ to 8 × 10⁻⁵ cm/s (B), after a global negative shift of the mT gate of −2 mV (C), after a global positive shift of the hT gate of +3 mV (D), after a decrease of A from 5.5 × 10⁻³ to 2.0 × 10⁻³ S/cm2 (E), and after an increase of NaP from 5.5 × 10⁻⁶ to 1.5 × 10⁻⁵ S/cm2 (F). G: repetitive burst firing elicited by depolarization after an increase of Kir from 2.0 × 10⁻⁵ to 1.0 × 10⁻⁴ S/cm2. Voltage traces in A–F were obtained by simulating negative current injection of −15 pA. Voltage trace in G was obtained by simulating positive current injection of +10 pA.
Fig. 8.
Fig. 8.
Minimal models capable of sustaining oscillations compatible with repetitive burst firing of TC neurons. A: top 3 traces show the effect of increasing magnitudes of hyperpolarizing current injection on the model cell containing IT and the sodium and potassium leak conductances with parameters set to default. Bottom 3 traces show spontaneous oscillations after an increase of pT to 7.0 × 10⁻⁵ cm/s (4th trace), oscillations induced by hyperpolarizing current injection of −3 pA after a shift of mT by −2 mV (5th trace), and spontaneous oscillations after a shift of hT by +2 mV (6th trace). B: voltage traces before (top trace) and after (bottom trace) depolarizing current injection on the model cell containing only Ih (h = 4.4 × 10⁻⁵), IKir (Kir = 3.0 × 10⁻⁴ S/cm2), and the leak conductances (default values of ). C: voltage traces from the model cell containing only IA, INaP, and the leak conductances with the maximum conductances set to default (top trace) and after A is changed to 3.0 × 10⁻³ S/cm2 and NaP to 3.0 × 10⁻⁵ S/cm2 (bottom trace).
Fig. 9.
Fig. 9.
Time course and relative contribution of subthreshold conductances during oscillations in the TC neuron model. A: time course of the currents and gating variables of IT during 2 cycles of oscillation of the TC neuron containing all 7 subthreshold conductances, induced by injection of hyperpolarizing current. The values were set to default for all conductances except IT (pT = 8.0 × 10⁻⁵ cm/s). The Ileak trace is the sum of IKleak and INaleak. For illustration purposes, the scale is the same for all currents and large deflections are truncated. The diagram at bottom represents the time course of the relative contribution of each current during oscillations. Horizontal dotted lines represent zero values for currents and gating variables and 50% of the total current in diagrams of relative contribution. Vertical dotted lines are positioned at the peak of the oscillation (a), the valley of the oscillation (b), and the time point of maximum contribution of IT (c).
Fig. 10.
Fig. 10.
Effects of simulated modulation of subthreshold conductances (other than IT) on the oscillatory behavior of the TC neuron model. Under the same conditions as in Fig. 9, data in A–C show the time course of the gating variables of IT and the relative contribution of the currents during spontaneous oscillations of the TC neuron model (colored stacked area plots) in the absence of Ih (A), during dampening oscillations of the TC model in the absence of IKir (B), and during oscillations induced by injection of hyperpolarizing current in the absence of IA (C). Vertical dotted lines in A and C are positioned similarly to those in Fig. 9; vertical dotted lines in B indicate the time points of maximum contribution of IT on each cycle. D: time course of the gating variables of IT (mT and hT) and Ih (mh) and the relative contribution of the currents during 2 cycles of oscillation induced by injection of depolarizing current after an increase of Kir to 1.2 × 10⁻⁴ S/cm2 while all other parameters are maintained at default (including IT at 5.0 × 10⁻⁵ cm/s). The interval between lines a and c illustrates the transient hyperpolarization generated by the interaction IKir-Ih, and the interval between lines c and d illustrates the transient depolarization (low-threshold spike, LTS) generated by the activation and inactivation of IT (see text). E: time course of the gating variables of IT and the relative contribution of the currents during oscillations induced by hyperpolarization after a decrease of A to 1.5 × 10⁻³ S/cm2. All other parameters are set to default. F: time course of the gating variables of IT and the relative contribution of the currents during oscillations induced by hyperpolarization after an increase of NaP to 1.8 × 10⁻⁵ S/cm2. Vertical lines in F and G are placed on the initial phase of depolarization to indicate the competing activation of IA and INaP. Note that during this phase the absolute current amplitude and the relative contribution are larger for INaP than for IA in both F and G.
Fig. 11.
Fig. 11.
Schematic representation of the interaction between the 7 subthreshold conductances and their roles in controlling the RMP and the oscillatory behavior of TC neurons. The leak conductances establish a background on which the other 5 voltage-dependent conductances interact: steadily active depolarizing variables (left quadrants) displace the membrane potential from the reversal potential (E) of the leak at the same time that steadily active hyperpolarizing variables (right quadrants) counteract depolarization. The RMP is a stable equilibrium (horizontal bar) reached by the balance achieved among all these forces. Periodicity is promoted by changes in certain parameter values that allow the destabilization of this equilibrium and the cyclic behavior of the membrane potential (curved arrows). Changes that favor the regenerative activation of the amplifying variables (black) increase the propensity to oscillate. These changes include either increasing the magnitude of amplifying variables themselves or decreasing the magnitude of resonant variables (gray). Conversely, an increase in the magnitude of resonant variables (and/or a decrease in the magnitude of amplifying variables) renders the model unable to oscillate periodically.

References

    1. Amarillo Y. Control of Neuronal Excitability by Subthreshold Operating Potassium Channels (PhD thesis). New York: New York University, 2007
    1. Amarillo Y, Nadal MS. On the repetitive burst firing of thalamic relay neurons. Program No. 46.08. 2011 Neuroscience Meeting Planner. Washington, DC: Society for Neuroscience, 2011
    1. Amarillo Y, Nadal MS, Rudy B. The inward rectifying potassium channel Kir2.2 regulates the excitability of thalamic relay neurons. Program No. 174.3 2005 Neuroscience Meeting Planner Washington, DC: Society for Neuroscience, 2005
    1. Anumonwo JM, Lopatin AN. Cardiac strong inward rectifier potassium channels. J Mol Cell Cardiol 48: 45–54, 2010 - PMC - PubMed
    1. Biel M, Wahl-Schott C, Michalakis S, Zong X. Hyperpolarization-activated cation channels: from genes to function. Physiol Rev 89: 847–885, 2009 - PubMed

Publication types

LinkOut - more resources