. 2014 Apr 23;34(17):5776-87.
doi: 10.1523/JNEUROSCI.5288-13.2014.

Crtc1 activates a transcriptional program deregulated at early Alzheimer's disease-related stages

Affiliations

Crtc1 activates a transcriptional program deregulated at early Alzheimer's disease-related stages

Arnaldo Parra-Damas et al. J Neurosci. .

Abstract

Cognitive decline is associated with gene expression changes in the brain, but the transcriptional mechanisms underlying memory impairments in cognitive disorders, such as Alzheimer's disease (AD), are largely unknown. Here, we aimed to elucidate relevant mechanisms responsible for transcriptional changes underlying early memory loss in AD by examining pathological, behavioral, and transcriptomic changes in control and mutant β-amyloid precursor protein (APPSw,Ind) transgenic mice during aging. Genome-wide transcriptome analysis using mouse microarrays revealed deregulation of a gene network related with neurotransmission, synaptic plasticity, and learning/memory in the hippocampus of APPSw,Ind mice after spatial memory training. Specifically, APPSw,Ind mice show changes on a cAMP-responsive element binding protein (CREB)-regulated transcriptional program dependent on the CREB-regulated transcription coactivator-1 (Crtc1). Interestingly, synaptic activity and spatial memory induces Crtc1 dephosphorylation (Ser151), nuclear translocation, and Crtc1-dependent transcription in the hippocampus, and these events are impaired in APPSw,Ind mice at early pathological and cognitive decline stages. CRTC1-dependent genes and CRTC1 levels are reduced in human hippocampus at intermediate Braak III/IV pathological stages. Importantly, adeno-associated viral-mediated Crtc1 overexpression in the hippocampus efficiently reverses Aβ-induced spatial learning and memory deficits by restoring a specific subset of Crtc1 target genes. Our results reveal a critical role of Crtc1-dependent transcription on spatial memory formation and provide the first evidence that targeting brain transcriptome reverses memory loss in AD.

Keywords: CREB; TORC; gene expression; memory; neurodegeneration; β-amyloid.


Figures
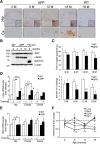
Figure 1.
Figure 1.
Age-dependent pathological, memory and gene expression changes in APPSw,Ind mice. A, Age-dependent amyloid pathology in the hippocampus of APPSw,Ind (APP) mice. Brain sections were stained with an anti-Aβ 6E10 antibody. M, months; Hip, hippocampus; Cx, cortex. Scale bars: Hp, 250 μm; Cx, 20 μm. B, Biochemical analysis of APP and APP C-terminal fragment (CTF; “Saeko” antibody) and α-secretase-derived αAPPs fragment (1736 antibody) in hippocampus of WT, APPSw,Ind and presenilin-1 (PS1) conditional knock-out mouse (PS1cKO). C, Age-dependent spatial memory deficits in APPSw,Ind mice analyzed as number of target platform crossings and percentage time in the target quadrant in the probe test in the MWM. Data are mean ± SEM (n = 7–8 mice/group); *p < 0.05, **p < 0.001. D, E, Mice were trained for 5 d in the water maze (+) or treated identically without training (−) before analysis of c-fos and Bdnf IV mRNAs by qRT-PCR in different brain regions. Levels of mRNA were normalized to Gapdh. Values represent mean ± SEM (n = 4–5 mice/group); *p < 0.01, **p < 0.001, ***p < 0.0001 compared with controls. #p < 0.01, ##p < 0.001 compared with nontrained. F, Expression of activity-dependent genes in trained APPSw,Ind hippocampus at 2–18 months. Values represent gene changes relative to trained nontransgenic controls. Data represent mean ± SEM (n = 4–6 mice/group); *p < 0.05, **p < 0.001, ***p < 0.0001 compared with trained controls. Statistical analyses were determined by two-way ANOVA followed by Scheffé's S post hoc test.
Figure 2.
Figure 2.
Hippocampal transcriptome changes in spatial trained APPSw,Ind mice. A, Experimental design of the groups used for gene profiling analyses (top) and Venn diagram (bottom) showing the number of genes differentially expressed in the hippocampus of APPSw,Ind mice versus control mice in the microarray analysis. B, ClueGO analysis of the whole gene microarray results showing the most significant functional gene network (k score > 0.5) altered in the hippocampus of spatial memory trained APPSw,Ind mice compared with trained WT mice. Biological pathways are visualized as colored nodes linked with related groups based on their κ score level (≥0.3). The node size reflects the enrichment significance of the term and functionally related groups are linked. Not grouped terms are shown in white. C, Heat map of the normalized gene data showing differential expression of CREB target genes in the hippocampus of naive (four top lines) and spatial trained (three bottom lines) APPSw,Ind mice versus WT mice. Blue and red indicate genes downregulated or upregulated in APPSw,Ind mice compared with WT mice. (D, E) Expression of genes associated with neurotransmission and synaptic plasticity quantified by qRT-PCR in the hippocampus of spatial trained WT and APPSw,Ind mice at 6 months (D) and 2 months (E). Values represent fold gene changes ± SEM (n = 4–5 mice/group). Values were normalized to the geometric mean of Ppia, Hprt, and β-actin. Bdnf refers to Bdnf IV; *p < 0.05, **p < 0.001 (D, E), compared with WT control or naive. Statistical analyses were determined by one-way ANOVA followed by Bonferroni post hoc test.
Figure 3.
Figure 3.
Reduced Crtc1 dephosphorylation, nuclear translocation and activation in APPSw,Ind mice. A, Biochemical analyses of Crtc1, pCrtc1 (Ser151), CREB, and pCREB (Ser133) in hippocampus of naive and memory trained control (WT) and APPSw,Ind mice. Values represent fold changes ± s.e.m (n = 4 mice/group); *p < 0.05, **p < 0.002, and #p < 0.05 compared with naive and WT mice, respectively. B, Reduced Crtc1 and unchanged CBP, CREB, and pCREB in purified nuclear brain extracts of trained APPSw,Ind mice. Data are the mean ± SEM (n = 3–4 mice/group); *p < 0.05 compared with controls. C, Confocal images showing localization of Crtc1 (green) and MAP2 (red) in DG, CA1, and CA3 hippocampus in naive and spatial trained mice. Nuclear translocation of Crtc1, as revealed by colocalization with Hoechst (blue; arrowheads) is more evident in CA3 hippocampal neurons of WT mice after spatial training, and reduced in trained APPSw,Ind mice. CA3: Green Crtc1 staining in the left side of the images represents terminal axons from DG granular cells (mossy fibers), whereas dendritic MAP2 staining (red) is detected as punctuate staining due to its transversal position in the coronal sections. Images (20×, zoom 0.5) are representative of n = 5–6 mice/group. Scale bar, 40 μm. D, Expression of CREB target genes in 10 DIV cultured neurons expressing scramble or Crtc1 shRNAs treated with vehicle (−) or FSK/KCl (+). Data are normalized to Gapdh and represent the mean ± SEM (n = 3); #p < 0.0001, *p < 0.05, **p < 0.01 compared with vehicle-treated or FSK/KCl-treated control neurons. E, Protein levels of Crtc1-dependent genes in noninfected (NI) or scramble (Scr)- or Crtc1 shRNA-infected neurons (10 DIV; n = 4–5 cultures per group); *p < 0.05, **p < 0.01 compared with scramble-FSK/KCl. Values are normalized to β-tubulin. F, ChiP analysis shows activity-dependent recruitment of Crtc1 to specific gene promoters. IgG, Irrelevant antibody. Data represent the mean ± SEM of three independent experiments; *p < 0.05, **p < 0.005, compared with IgG FSK/KCl IP. G, Expression of Arc (green) is evident in neurons expressing high Crtc1 levels (red; arrowheads) compared with neurons with very low Crtc1 levels (arrows) in CA3 hippocampus of WT trained mice. Scale bar, 20 μm. Statistical analysis was determined by one- or two-way ANOVA followed by Student-Newman–Keuls post hoc test.
Figure 4.
Figure 4.
Adeno-associated viral-mediated Crtc1 overexpression prevents early Aβ-induced transcriptional and memory deficits. A, Long-term Crtc1-myc expression in the mouse dorsal hippocampus. Overexpression of Crtc1-myc (green) in CA3 pyramidal neurons (NeuN, red) three weeks after stereotaxic intrahippocampal AAV-Crtc1-myc injection. Injection point is indicated in red in the brain diagram. Insets, Magnified images of the selected regions (square) showing Crtc1-myc localization in the neuronal nucleus (left inset) or cytoplasm (right inset). Scale bar, 50 μm. B, Increased Crtc1-myc and total Crtc1 mRNAs normalized to Gapdh in AAV-Crtc1-myc-injected mice. Data are the mean ± SEM (n = 4–5 mice/group); *p < 0.05, **p < 0.001, compared with AAV-GFP-injected control mice. C, Crtc1-myc protein levels in injected mice. Data are the mean ± SEM (n = 4 mice/group); **p < 0.001 compared with AAV-GFP-injected control mice. D, Overexpression of AAV-Crtc1 rescues spatial learning (top panel) and long-term memory (middle and bottom panels) deficits in 6-month-old APPSw,Ind mice. Data indicate percentage of time in the target quadrant or number of target platform crossings compared with the average of time or number of crossings in the three other quadrants, respectively. Data are the mean ± SEM (n = 8 mice/group); *p < 0.002, **p < 0.0001, compared with controls or the average of other quadrants as determined by two-way ANOVA. E, Crtc1-dependent gene expression normalized to the geometric mean of Gapdh, Hprt1, and Tbp in hippocampus of AAV-injected mice. Data represents the mean ± SEM (n = 4–5 mice/group); *p < 0.05 compared with WT-GFP; #p < 0.05 compared with APP-GFP mice. Statistical analyses were determined by one- or two-way ANOVA followed by Student-Newman–Keuls post hoc test.
Figure 5.
Figure 5.
CRTC1 levels and transcriptional changes in human brain at intermediate AD pathological stages. A, Levels of Arc, NR4A2, CRTC1, and CYR61 transcripts in the human hippocampus at Braak 0 (Control; n = 16), I–II (n = 22), III–IV (n = 14), and V–VI (n = 16) stages. Arc is significantly reduced at early (I–II) and intermediate (III–IV) Braak stages compared with controls (F(3,64) = 4.7, p < 0.005), whereas NR4A2 is reduced at intermediate stages. Gene changes in log2 scale relative to controls are normalized to the geometric mean of PPIA, GAPDH, and β-actin. Values represent mean ± SEM; *p < 0.05, **p < 0.02, compared with controls. B, Western blotting and quantification of total and phosphorylated (Ser151) CRTC1 (pCRTC1) in human hippocampus at different AD stages. Values represent mean fold change ± SEM (n = 5–12 per group); *p < 0.05 compared with control as determined by one-way ANOVA followed by Scheffé's S post hoc test.

Similar articles

Cited by

References

    1. Altarejos JY, Goebel N, Conkright MD, Inoue H, Xie J, Arias CM, Sawchenko PE, Montminy M. The Creb1 coactivator Crtc1 is required for energy balance and fertility. Nat Med. 2008;14:1112–1117. doi: 10.1038/nm.1866. - DOI - PMC - PubMed
    1. Battke F, Symons S, Nieselt K. Mayday: -integrative analytics for expression data. BMC Bioinformatics. 2010;11:121. doi: 10.1186/1471-2105-11-121. - DOI - PMC - PubMed
    1. Benito E, Valor LM, Jimenez-Minchan M, Huber W, Barco A. cAMP response element-binding protein is a primary hub of activity-driven neuronal gene expression. J Neurosci. 2011;31:18237–18250. doi: 10.1523/JNEUROSCI.4554-11.2011. - DOI - PMC - PubMed
    1. Benjamini Y, Hochberg Y. Controlling the false discovery rate: a practical and powerful approach to multiple testing. J R Stat Soc Ser B. 1995;57:289–300.
    1. Bindea G, Mlecnik B, Hackl H, Charoentong P, Tosolini M, Kirilovsky A, Fridman WH, Pagès F, Trajanoski Z, Galon J. ClueGO: a cytoscape plug-in to decipher functionally grouped gene ontology and pathway annotation networks. Bioinformatics. 2009;25:1091–1093. doi: 10.1093/bioinformatics/btp101. - DOI - PMC - PubMed

Publication types

MeSH terms

Substances