. 2014 Apr 23;34(17):5788-99.
doi: 10.1523/JNEUROSCI.0674-14.2014.

Continuous postnatal neurogenesis contributes to formation of the olfactory bulb neural circuits and flexible olfactory associative learning

Affiliations

Continuous postnatal neurogenesis contributes to formation of the olfactory bulb neural circuits and flexible olfactory associative learning

Masayuki Sakamoto et al. J Neurosci. .

Abstract

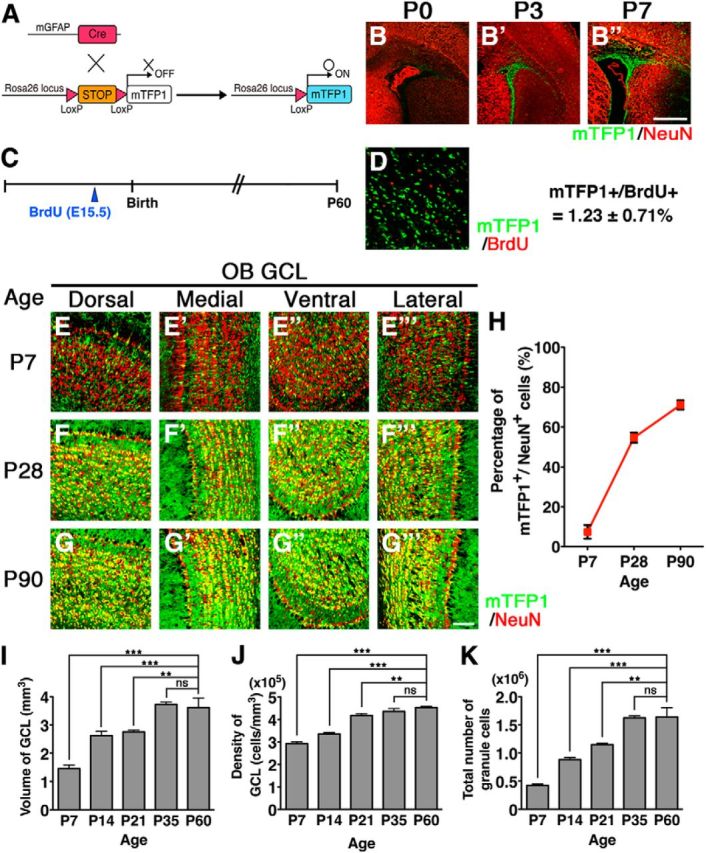
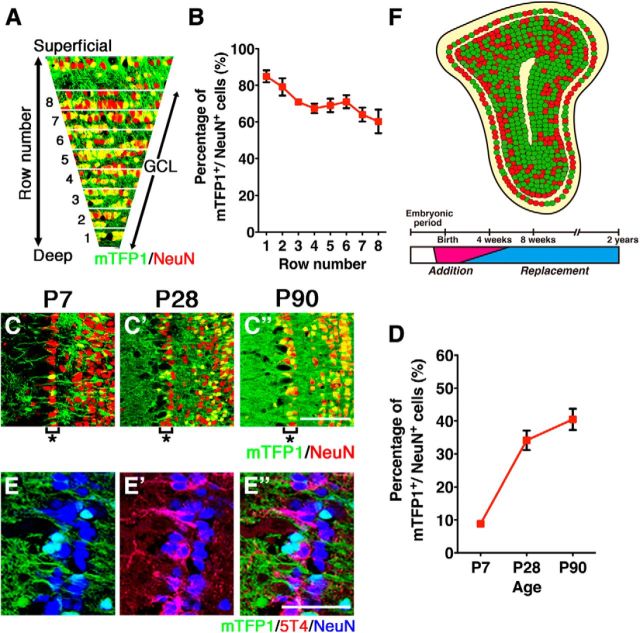
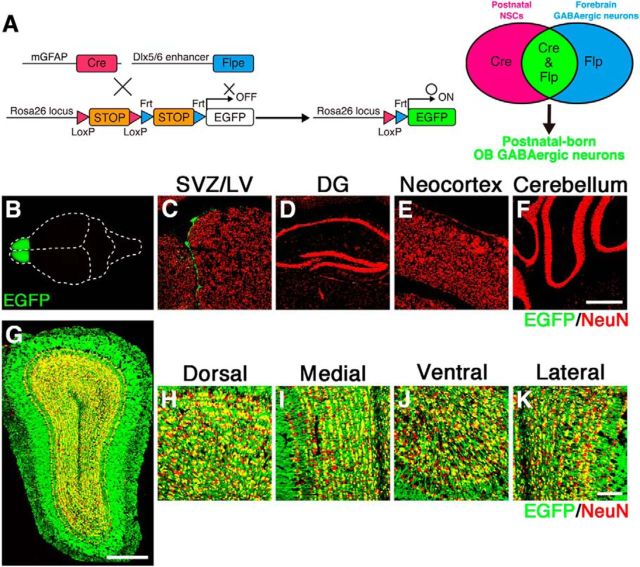
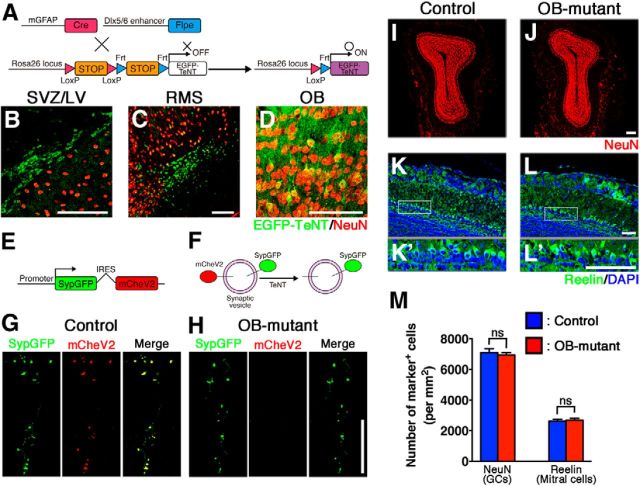
The olfactory bulb (OB) is one of the two major loci in the mammalian brain where newborn neurons are constantly integrated into the neural circuit during postnatal life. Newborn neurons are generated from neural stem cells in the subventricular zone (SVZ) of the lateral ventricle and migrate to the OB through the rostral migratory stream. The majority of these newborn neurons differentiate into inhibitory interneurons, such as granule cells and periglomerular cells. It has been reported that prolonged supply of newborn neurons leads to continuous addition/turnover of the interneuronal populations and contributes to functional integrity of the OB circuit. However, it is not still clear how and to what extent postnatal-born neurons contribute to OB neural circuit formation, and the functional role of postnatal neurogenesis in odor-related behaviors remains elusive. To address this question, here by using genetic strategies, we first determined the unique integration mode of newly born interneurons during postnatal development of the mouse OB. We then manipulated these interneuron populations and found that continuous postnatal neurogenesis in the SVZ-OB plays pivotal roles in flexible olfactory associative learning and memory.

Keywords: dentate gyrus; hippocampus; learning; neural stem cells; neurogenesis; olfactory bulb.


Figures

Figure 1.
Figure 1.
Postnatal neurogenesis in the OB visualized by mTFP1 fluorescent protein in mGFAP-Cre;R26R-CAG-LoxP-mTFP1 double transgenic mice. A, Schematic drawing of genetic strategy to label progeny of postnatal NSCs. B–B′′, Sections including the SVZ/LV were immunostained with anti-NeuN (red) antibody. Cre-reporter (mTFP1)-expressing cells (green) were observed in the postnatal SVZ/LV. C, Experimental design. BrdU was administered to the E15.5 double transgenic mice, and the OBs were analyzed at P60. D, BrdU-positive cells (red) were detected by immunostaining in the dorsal regions of the GCLs of the OB. Only 1.23 ± 0.71% of BrdU-positive cells displayed mTFP1 expression in mGFAP-Cre;R26R-CAG-LoxP-mTFP1 mice. E–G′′′, GCLs of the OB were immunostained with anti-NeuN (red) antibody at P7, P28, and P90. Postnatal-born GCs were visualized via mTFP1 fluorescence (green). The number of mTFP1-expressing GCs increased during postnatal periods from P7 to P90. H, Proportions of mTFP1-expressing GCs in the OB during postnatal development. Data points represent mean ± SD from at least three mice. I–K, Bar graphs summarizing volume (I), cell density (J), and total cell number (K) of GCLs in the OB during postnatal development. The numbers of GCs in the OB increased significantly. Data are mean ± SD from each of three mice. **p < 0.01; ***p < 0.001; one-way ANOVA followed by Tukey's post hoc test. ns, Not significant. Scale bars: B, 500 μm; G′′′, 100 μm.
Figure 2.
Figure 2.
Integration modes of newborn neurons in the GCL of the postnatal OB. A, B, Coronal sections through the GCL of the OB from P90 mGFAP-Cre;R26R-CAG-LoxP-mTFP1 mice were divided into eight rows, and the ratios of mTFP1 to NeuN labeling were determined in each row. C–C′′, Outer GCLs of mGFAP-Cre;R26R-CAG-LoxP-mTFP1 mice at P7, P28, and P90 were immunostained by anti-NeuN (red) antibody. Outer GCLs are indicated by asterisks. A restricted number of newborn neurons were incorporated into the outer GCL of the OB. D, Quantification of mTFP1 versus NeuN labeling ratios in outer GCs of the OB during postnatal development. Data points represent mean ± SD from at least three mice. E–E′′, Outer GCs labeled by 5T4 (red) were typically negative for mTFP1 labeling. F, Proposed model of integration modes of postnatal-born GCs in the main OB. In the OB schematics, postnatal-born GCs and embryonic-born GCs were indicated by green dots and red dots, respectively. In the OB, newborn neurons are integrated into and build up the basic architecture of the OB neural circuit before 4 weeks of age. After that, it is likely that the dynamic turnover of old GCs and newborn GCs occurs continuously. Postnatal-born GCs are preferentially integrated into deep regions of the GCL in the OB. Scale bars: C′′, 100 μm; E′′, 50 μm.
Figure 3.
Figure 3.
Postnatal development of the PGL in the OB. A–D′′′, The PGL of mGFAP-Cre;R26R-CAG-LoxP-mTFP1 mice at P7 (A–A′′′), 1 month (B–B′′′), 3 months (C–C′′′), and 12 months (D–D′′′) of age. Postnatal-born PGCs were visualized via mTFP1 fluorescence (green). The number of mTFP1-expressing PGCs increased during the postnatal periods. E–G, Representative images of immunostaining by CalR (E; red), CalB (F; red), or TH (G; red) in the medial PGL at 6 months of age. H, Proportions of mTFP1-expressing cells in the PGLs of the OB during postnatal development. I, Proportions of mTFP1-labeling in the CalR-, CalB-, and TH-expressing PGCs during postnatal development. Data points represent mean ± SD from at least three mice. Scale bars, 100 μm.
Figure 4.
Figure 4.
Specific genetic targeting of postnatal-born GCs by Cre/loxP- and Flp/Frt-mediated intersectional strategy. A, Schematic drawing of genetic strategy to selectively target postnatal-born GABAergic neurons by mGFAP-Cre and Dlx5/6-Flpe transgenic mouse strains. B, Dorsal view of the whole brain from adult mGFAP-Cre;Dlx5/6-Flpe;R26R-CAG-LoxP-Frt-EGFP triple transgenic mice. C–K, EGFP expressions (green) were specifically expressed by neuroblasts in the SVZ of the LV (C) and by the GABAergic interneurons in the OB (G–K), but not in the DG (D), neocortex (E), or cerebellum (F). Scale bars, 500 μm (F,G) and 100 μm (K).
Figure 5.
Figure 5.
Inhibiting synaptic transmission in postnatal-born GCs in the OB. A, Schematic drawing of specific silencing of postnatal-born OB neurons using R26R-CAG-LoxP-Frt-EGFP-TeNT transgenic mouse strain. B–D, EGFP-TeNT expression was specifically observed in the SVZ/LV (B), RMS (C), and OB (D) of adult mGFAP-Cre;Dlx5/6-Flpe;R26R-CAG-LoxP-Frt-EGFP-TeNT triple transgenic mice. E, A schematic drawing of Moloney viral vector encoding bicistronic GFP-fused synaptophysin (SypGFP) and mCherry-fused VAMP2 (mCheV2). Virus was injected into the SVZ/LV, and the OB was analyzed 4 weeks later. F, A schematic drawing of SypGFP- and mCheV2-labeled synaptic vesicles. TeNT cleaves the mCheV2, leading to loss of mCheV2 immunoreactivity. G, H, Presence of mCheV2-positive puncta in OB sections from control (mGFAP-Cre;R26R-CAG-LoxP-Frt-TeNT double transgenic) mice (G) and its absence in the sections from OB-mutant (mGFAP-Cre;Dlx5/6-Flpe;R26R-CAG-LoxP-Frt-EGFP-TeNT triple transgenic) mice, indicating specific inhibition of synaptic transmission in postnatal-born GCs (H). I, J, Coronal sections of the adult OB from control and OB-mutant mice stained with anti-NeuN antibodies (red). No apparent histological differences were observed between control and OB-mutant mice. K–L′, Mitral cells identified by Reelin expression (green) were normally developed in OB-mutant mice. K, L, Boxed regions are magnified in K′ and L′, respectively. M, Graph showing no difference in density of NeuN-positive GCs and Reelin-positive mitral cells in control and OB-mutant mice. The average of three independent samples with SD. ns, Not significant (two-tailed Student's t test). Scale bars, 100 μm (B,C,K–L′); 75 μm (D); 67.5um (G,H); 200 μm (I,J).
Figure 6.
Figure 6.
Habituation–dishabituation tests. A, Mean investigation time (seconds) ± SEM in the habituation (trials 1–3) and dishabituation trials. In trials 1–3, filter papers with mineral oil were presented to mice for 3 min with 10 min intervals. In trial 4, filter papers scented with basil were presented to the mice for 3 min. There were no differences in investigation time in each trial for the control (n = 6) and OB-mutant (n = 6) mice. Both groups showed significantly increased investigation after the dishabituating odor (between trials 3 and 4). B, Habituation (trials 1–4; basil odor) and dishabituation trials (trials 5; peppermint odor). Both groups again showed significantly increased investigation after the dishabituating odor (between trials 4 and 5). ns, Not significant. **p < 0.01 (two-tailed Student's t test). ***p < 0.001 (two-tailed Student's t test).
Figure 7.
Figure 7.
Postnatal-born GCs regulate flexible olfactory associative learning. A, B, A schematic drawing of the experimental time course (A), and schematic representation of the olfactory associative memory test (B). Three-month-old control and OB-mutant mice were trained for 4 d to associate a reward (sugar grains) with either of two related odorants ((+)- and (−)-carvone enantiomers). On day 5 (single arrowhead), the carvone enantiomers were presented without the sugar reward, and digging time was measured for each pair of related odorants. After the initial probe test, the sugar reward was associated with the other odorant, and the first reversal learning task was started on the same day. From days 6 to 9 (double arrowheads), probe tests for reversal learning were performed every day, and reversal learning trials were conducted immediately after each probe test. On day 9, after the probe test, the sugar reward was again associated with the initial odorant, and the second reversal learning was started. From days 10 to 12 (triple arrowheads), probe tests for the second reversal learning were performed every day followed by continuing learning. C, D, Control (n = 6) and OB-mutant (n = 6) were subjected to the above flexible olfactory associative memory test. Mean digging times (seconds) ± SEM during the 4 min probe test period are shown. *p < 0.05; **p < 0.01; ***p < 0.001; two-way repeated-measures ANOVA of odor and day followed by Fisher's LSD post hoc test (control; odor: F(1,5) = 4.542, p = 0.0863; day: F(7,35) = 1.386, p = 0.2420; interaction: F(7,35) = 20.18, p < 0.0001, OB-mutant: odor: F(1,5) = 1.556, p = 0.2803; day: F(7,35) = 1.731, p = 0.1423; interaction: F(7,35) = 7.471, p < 0.0001). E, Ratio was calculated for probe test period using the digging times according to the following formula: (+)-carvone/((+)-carvone + (−)-carvone). *p < 0.05; **p < 0.01; two-way repeated-measures ANOVA of mouse group and day followed by Fisher's LSD post hoc test (group: F(1,10) = 0.2566, p = 0.6247; day: F(7,70) = 19.31, p < 0.0001; interaction: F(7,70) = 3.957, p < 0.0012).
Figure 8.
Figure 8.
Late-postnatal neurogenesis is required for flexible olfactory associative learning. A, Schematic drawing of specific ablation of newly generated neurons. Tamoxifen-inducible Nestin-CreERT2 mice were crossed with NSE-LoxP-DTA mice, in which the LoxP-Stop-LoxP-IRES-DT-A gene cassette was knocked into the 3′-noncoding region of the NSE gene. After tamoxifen administration in adult mice, CreERT2 is activated and DT-A is ready for expression. In newly generated neurons, the NSE promoter becomes active and induces apoptotic cell death by the expression of DT-A. B, Tamoxifen or oil vehicle was administered to P21 transgenic mice. At 14 d after treatment, control (n = 9) and neurogenesis-mutant (n = 9) mice were subjected to the olfactory associative memory tests described in Figure 7A, B. C, D, Postnatal neurogenesis-mutant mice showed severe impairment of flexible associative olfactory learning and memory. Mean digging times (seconds) ± SEM during the 4 min probe test period are shown. *p < 0.05; **p < 0.01; ***p < 0.001: two-way repeated-measures ANOVA of odor and day followed by Fisher's LSD post hoc test (control; odor: F(1,8) = 22.22, p = 0.0015; day: F(7,56) = 3.229, p = 0.0052; interaction: F(7,56) = 18.12, p < 0.0001, postnatal neurogenesis-mutant: odor: F(1,8) = 27.36, p = 0.0008; day: F(7,56) = 2.352, p = 0.0353; interaction: F(7,56) = 12.42, p < 0.0001). E, Ratio was calculated for probe test period using the digging times according to the following formula: (+)-carvone/((+)-carvone + (−)-carvone). **p < 0.01; ***p < 0.001; two-way repeated-measures ANOVA of mouse group and day followed by Fisher's LSD post hoc test (group: F(1,16) = 0.4255, p = 0.5235; day: F(7,112) = 24.53, p < 0.0001; interaction: F(10,60) = 7.549, p < 0.0001).
Figure 9.
Figure 9.
Blocking synaptic transmission of postnatal-born GCs in the hippocampal DG does not affect flexible olfactory associative learning. A, Schematic drawing of our genetic strategy to selectively target postnatal-born GCs in the hippocampal DG. Postnatal NSC Cre-driver, mGFAP-Cre mice were crossed with VGLUT1-LoxP-TeNT mice, in which the LoxP-Stop-LoxP-IRES-TeNT gene cassette was knocked into the 3′-noncoding region of the glutamatergic, neuron-specific VGLUT1 gene locus. B, C, Hippocampal sections from adult control (B) and DG-mutant (C) mice stained with anti-VAMP2 antibody (red) and nuclear DAPI (blue). Hippocampal CA3-regions are magnified in B′ and C′, respectively. D, E, Control (n = 6) and DG-mutant (n = 6) mice were subjected to the same olfactory associative memory tests shown in Figure 7A, B. DG-mutant mice did not exhibit impaired flexible associative olfactory learning and memory. Mean digging times (seconds) ± SEM during the 4 min probe test period are shown. *p < 0.05; **p < 0.01; ***p < 0.001; two-way repeated-measures ANOVA of odor and day followed by Fisher's LSD post hoc test (control; odor: F(1,5) = 9.044, p = 0.0298; day: F(7,35) = 1.782, p = 0.1222; interaction: F(7,35) = 19.07, p < 0.0001, DG-mutant: odor: F(1,5) = 4.058, p = 0.1142; day: F(7,35) = 1.754, p = 0.1370; interaction: F(7,35) = 17.87, p < 0.0001). F, Ratio was calculated for probe test period using the digging times according to the following formula: (+)-carvone/((+)-carvone + (−)-carvone). *p < 0.05; **p < 0.01; ***p < 0.001; two-way repeated-measures ANOVA of mouse group and day followed by Fisher's LSD post hoc test (group: F(1,10) = 2.966, p = 0.1233; day: F(7,70) = 12.65, p < 0.0001; interaction: F(7,70) = 7.503, p < 0.0012). Scale bars, 100 μm.

Similar articles

Cited by

References

    1. Adam Y, Mizrahi A. Long-term imaging reveals dynamic changes in the neuronal composition of the glomerular layer. J Neurosci. 2011;31:7967–7973. doi: 10.1523/JNEUROSCI.0782-11.2011. - DOI - PMC - PubMed
    1. Ahn S, Joyner AL. In vivo analysis of quiescent adult neural stem cells responding to Sonic hedgehog. Nature. 2005;437:894–897. doi: 10.1038/nature03994. - DOI - PubMed
    1. Alonso M, Lepousez G, Wagner S, Bardy C, Gabellec MM, Torquet N, Lledo PM. Activation of adult-born neurons facilitates learning and memory. Nat Neurosci. 2012;15:899–904. doi: 10.1038/nn.3108. - DOI - PubMed
    1. Anderson JC, Douglas RJ, Martin KA, Nelson JC. Map of the synapses formed with the dendrites of spiny stellate neurons of cat visual cortex. J Comp Neurol. 1994;341:25–38. doi: 10.1002/cne.903410104. - DOI - PubMed
    1. Bagley J, LaRocca G, Jimenez DA, Urban NN. Adult neurogenesis and specific replacement of interneuron subtypes in the mouse main olfactory bulb. BMC Neurosci. 2007;8:92. doi: 10.1186/1471-2202-8-92. - DOI - PMC - PubMed

Publication types

MeSH terms

LinkOut - more resources