

Developmental changes in the organization of functional connections between the basal ganglia and cerebral cortex
- PMID: 24760844
- PMCID: PMC3996213
- DOI: 10.1523/JNEUROSCI.3069-13.2014
Developmental changes in the organization of functional connections between the basal ganglia and cerebral cortex
Abstract
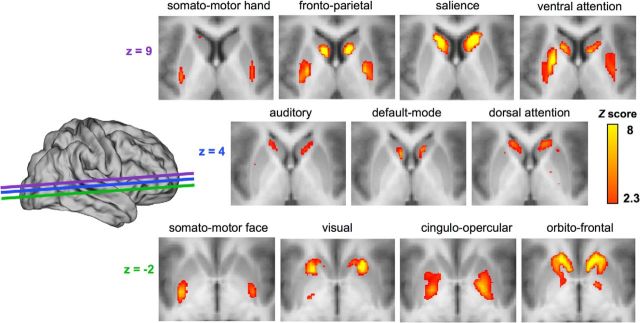
The basal ganglia (BG) comprise a set of subcortical nuclei with sensorimotor, cognitive, and limbic subdivisions, indicative of functional organization. BG dysfunction in several developmental disorders suggests the importance of the healthy maturation of these structures. However, few studies have investigated the development of BG functional organization. Using resting-state functional connectivity MRI (rs-fcMRI), we compared human child and adult functional connectivity of the BG with rs-fcMRI-defined cortical systems. Because children move more than adults, customized preprocessing, including volume censoring, was used to minimize motion-induced rs-fcMRI artifact. Our results demonstrated functional organization in the adult BG consistent with subdivisions previously identified in anatomical tracing studies. Group comparisons revealed a developmental shift in bilateral posterior putamen/pallidum clusters from preferential connectivity with the somatomotor "face" system in childhood to preferential connectivity with control/attention systems (frontoparietal, ventral attention) in adulthood. This shift was due to a decline in the functional connectivity of these clusters with the somatomotor face system over development, and no change with control/attention systems. Applying multivariate pattern analysis, we were able to reliably classify individuals as children or adults based on BG-cortical system functional connectivity. Interrogation of the features driving this classification revealed, in addition to the somatomotor face system, contributions by the orbitofrontal, auditory, and somatomotor hand systems. These results demonstrate that BG-cortical functional connectivity evolves over development, and may lend insight into developmental disorders that involve BG dysfunction, particularly those involving motor systems (e.g., Tourette syndrome).
Keywords: basal ganglia; development; functional connectivity; resting state.
Figures


Similar articles
-
The effects of age on resting state functional connectivity of the basal ganglia from young to middle adulthood.Neuroimage. 2015 Feb 15;107:311-322. doi: 10.1016/j.neuroimage.2014.12.016. Epub 2014 Dec 13. Neuroimage. 2015. PMID: 25514518 Free PMC article.
-
Association between the basal ganglia and large-scale brain networks in epilepsy.Brain Topogr. 2013 Apr;26(2):355-62. doi: 10.1007/s10548-012-0272-8. Epub 2013 Feb 12. Brain Topogr. 2013. PMID: 23400553
-
Large-scale cortico-subcortical functional networks in focal epilepsies: The role of the basal ganglia.Neuroimage Clin. 2016 Dec 18;14:28-36. doi: 10.1016/j.nicl.2016.12.014. eCollection 2017. Neuroimage Clin. 2016. PMID: 28123951 Free PMC article.
-
Functional anatomy of the basal ganglia: limbic aspects.Rev Neurol (Paris). 2012 Aug-Sep;168(8-9):569-75. doi: 10.1016/j.neurol.2012.06.015. Epub 2012 Aug 14. Rev Neurol (Paris). 2012. PMID: 22902172 Review.
-
Learning robust cortico-cortical associations with the basal ganglia: an integrative review.Cortex. 2015 Mar;64:123-35. doi: 10.1016/j.cortex.2014.10.011. Epub 2014 Oct 27. Cortex. 2015. PMID: 25461713 Review.
Cited by
-
Autism-associated Nf1 deficiency disrupts corticocortical and corticostriatal functional connectivity in human and mouse.Neurobiol Dis. 2019 Oct;130:104479. doi: 10.1016/j.nbd.2019.104479. Epub 2019 May 22. Neurobiol Dis. 2019. PMID: 31128207 Free PMC article.
-
Evaluating the Prediction of Brain Maturity From Functional Connectivity After Motion Artifact Denoising.Cereb Cortex. 2019 Jun 1;29(6):2455-2469. doi: 10.1093/cercor/bhy117. Cereb Cortex. 2019. PMID: 29850877 Free PMC article.
-
An Allometric Analysis of Sex and Sex Chromosome Dosage Effects on Subcortical Anatomy in Humans.J Neurosci. 2016 Feb 24;36(8):2438-48. doi: 10.1523/JNEUROSCI.3195-15.2016. J Neurosci. 2016. PMID: 26911691 Free PMC article.
-
Anomalous Putamen Volume in Children With Complex Motor Stereotypies.Pediatr Neurol. 2016 Dec;65:59-63. doi: 10.1016/j.pediatrneurol.2016.08.023. Epub 2016 Sep 8. Pediatr Neurol. 2016. PMID: 27751663 Free PMC article.
-
Normative development of ventral striatal resting state connectivity in humans.Neuroimage. 2015 Sep;118:422-37. doi: 10.1016/j.neuroimage.2015.06.022. Epub 2015 Jun 16. Neuroimage. 2015. PMID: 26087377 Free PMC article.
References
-
- Alexander GE, DeLong MR. Microstimulation of the primate neostriatum. II. Somatotopic organization of striatal microexcitable zones and their relation to neuronal response properties. J Neurophysiol. 1985;53:1417–1430. - PubMed
Publication types
MeSH terms
Grants and funding
LinkOut - more resources
Full Text Sources
Other Literature Sources