. 2014 Apr 23;34(17):5985-97.
doi: 10.1523/JNEUROSCI.4367-13.2014.

Modulation dynamics in the orofacial sensorimotor cortex during motor skill acquisition

Affiliations

Modulation dynamics in the orofacial sensorimotor cortex during motor skill acquisition

Fritzie I Arce-McShane et al. J Neurosci. .

Abstract

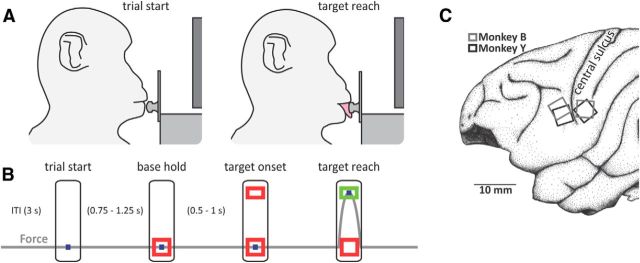
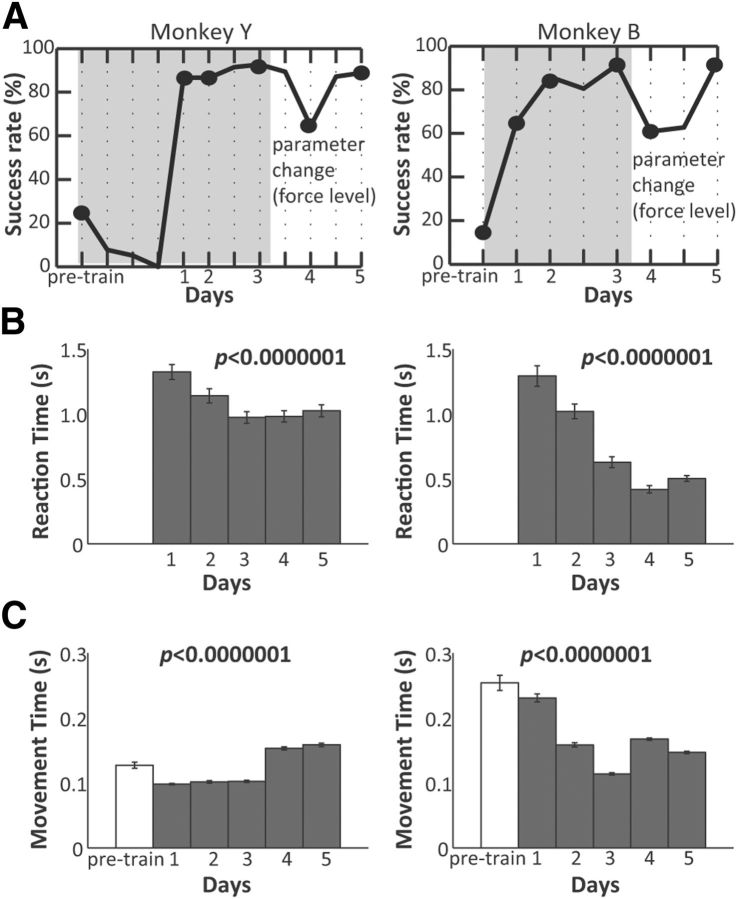
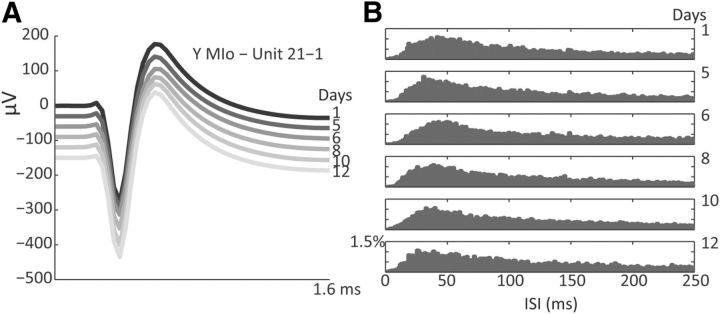
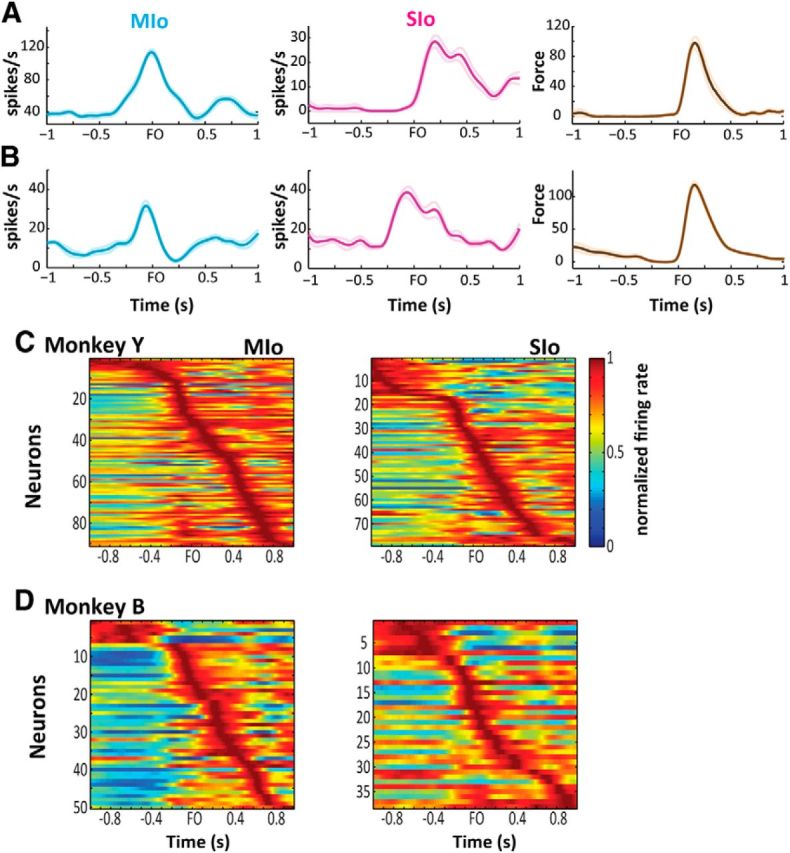
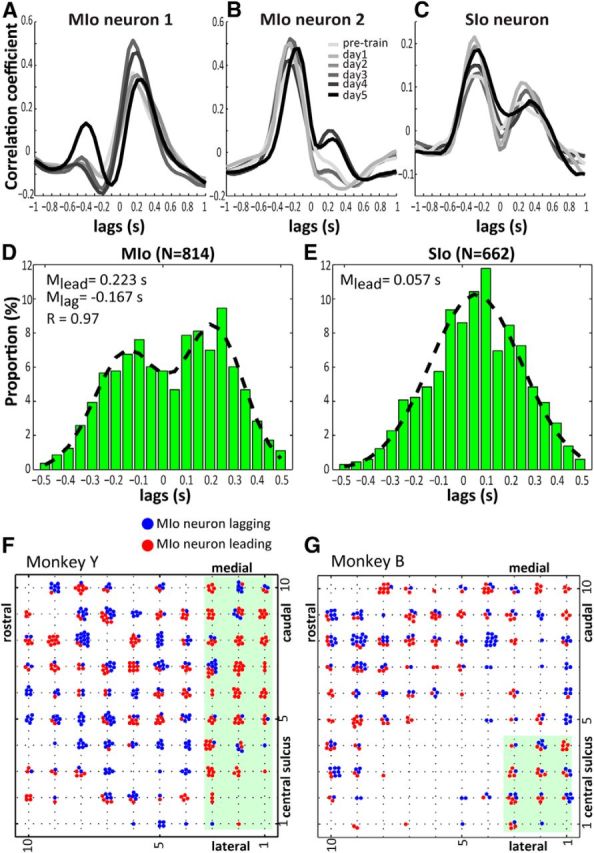
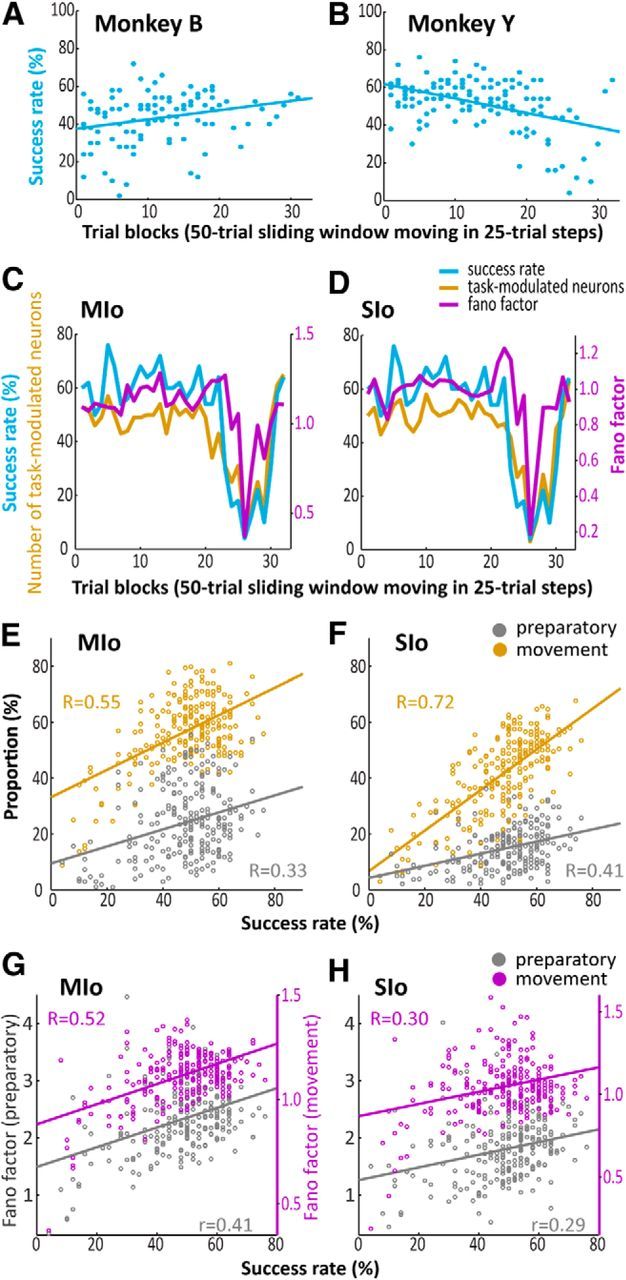
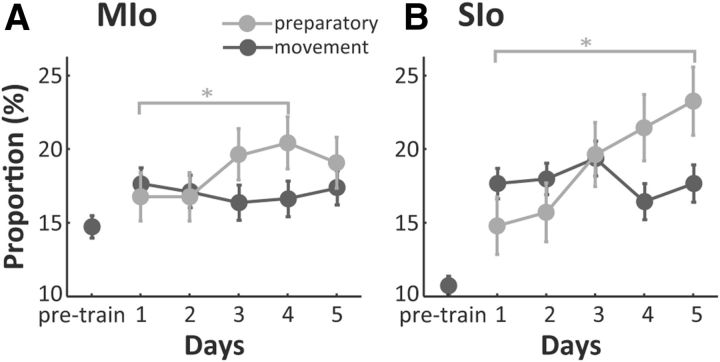
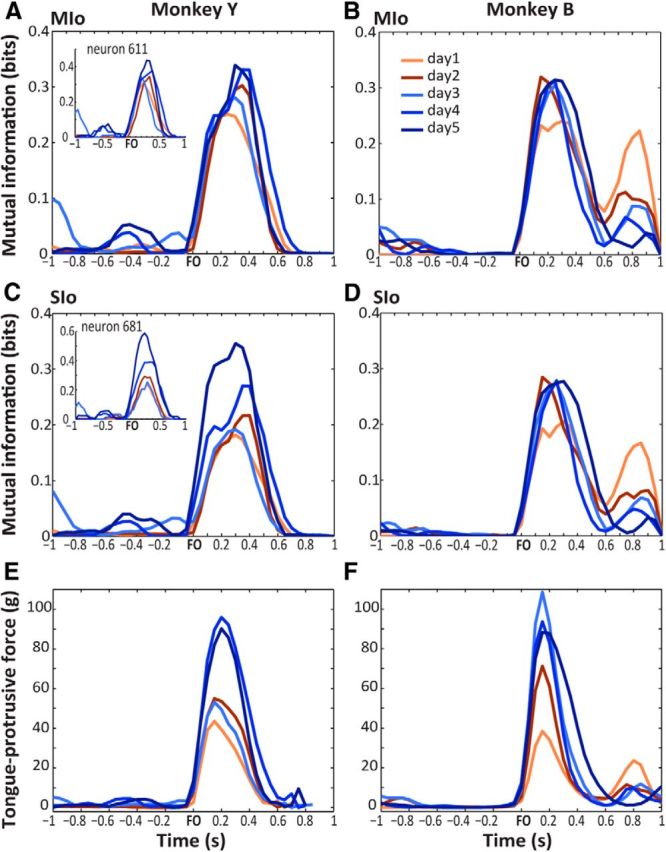
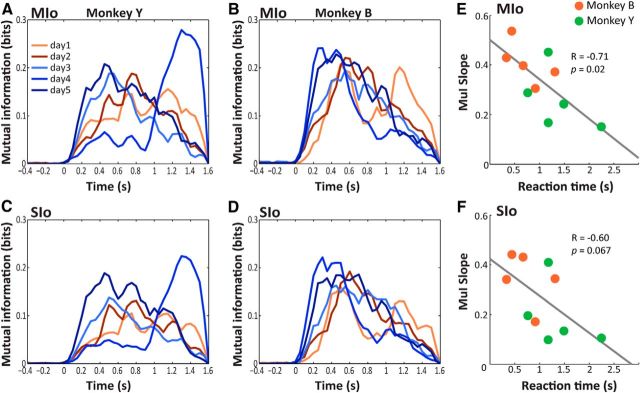
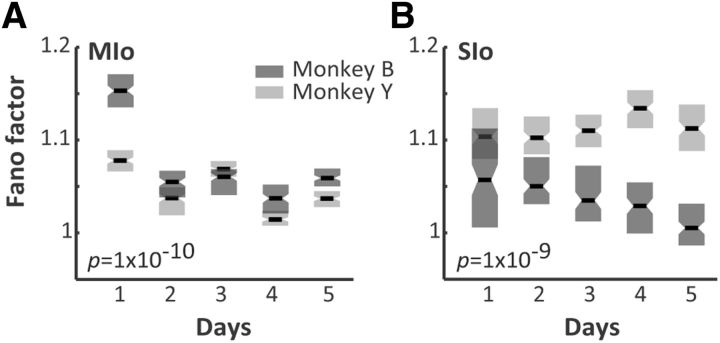
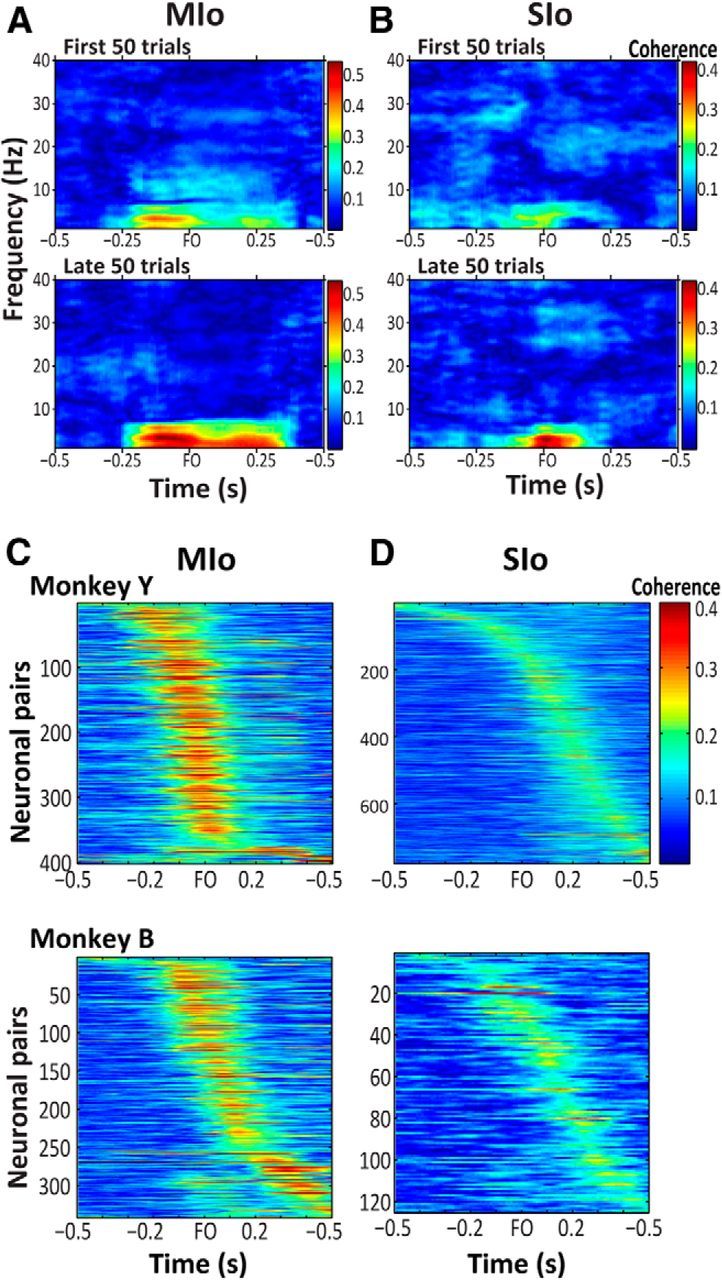
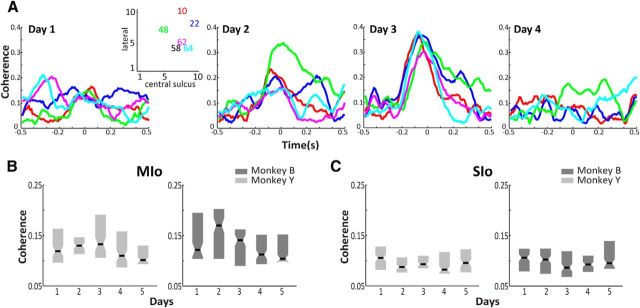
The orofacial sensorimotor cortex is known to play a role in motor learning. However, how motor learning changes the dynamics of neuronal activity and whether these changes differ between orofacial primary motor (MIo) and somatosensory (SIo) cortices remain unknown. To address these questions, we used chronically implanted microelectrode arrays to track learning-induced changes in the activity of simultaneously recorded neurons in MIo and SIo as two naive monkeys (Macaca mulatta) were trained in a novel tongue-protrusion task. Over a period of 8-12 d, the monkeys showed behavioral improvements in task performance that were accompanied by rapid and long-lasting changes in neuronal responses in MIo and SIo occurring in parallel: (1) increases in the proportion of task-modulated neurons, (2) increases in the mutual information between tongue-protrusive force and spiking activity, (3) reductions in the across-trial firing rate variability, and (4) transient increases in coherent firing of neuronal pairs. More importantly, the time-resolved mutual information in MIo and SIo exhibited temporal alignment. While showing parallel changes, MIo neurons exhibited a bimodal distribution of peak correlation lag times between spiking activity and force, whereas SIo neurons showed a unimodal distribution. Moreover, coherent activity between pairs of MIo neurons was higher and centered around force onset compared with pairwise coherence of SIo neurons. Overall, the results suggest that the neuroplasticity in MIo and SIo occurring in parallel serves as a substrate for linking sensation and movement during sensorimotor learning, whereas the differing dynamic organizations reflect specific ways to control movement parameters as learning progresses.

Keywords: electrophysiology; information; learning; motor cortex; orofacial; somatosensory cortex.


Figures

Figure 1.
Figure 1.
Experimental setup. A, Monkey position relative to the transducer and monitor. B, Diagram of the sequence of events in a trial of the tongue-protrusion task. Blue square represents the cursor. Colored boxes represent the base and force targets. A plot of the amplitude of tongue-protrusive force associated with the cursor displacement is superimposed for illustration (gray line). C, Location of MIo and SIo arrays of Monkey Y and Monkey B. Adapted from Arce et al., 2013.
Figure 2.
Figure 2.
Behavioral changes with practice. A, Success rates. Dots indicate the 6 d that were analyzed. Required force level was 50 g from pre-train to analysis days 1–3 and was increased to 80 g on analysis days 4 and 5. B, Reaction time shown as mean across all trials for each analysis day. Reaction times for pre-train were excluded because monkeys responded not to target onset but to juice reward delivered manually by the experimenter. C, Movement time shown as mean across all trials for each analysis day. Error bars indicate SE. p values correspond to Kruskal–Wallis test. All behavioral parameters are shown separately for each monkey.
Figure 3.
Figure 3.
Stable recording across 12 d. Example of a stable unit in MIo from Monkey Y. A, Average waveforms of the unit recorded from each day session. B, Histograms of the ISI from each day session.
Figure 4.
Figure 4.
Modulation of neuronal activity to tongue-protrusion task. A, B, PETHs (± SE), smoothed by a 50 ms Gaussian kernel of four simultaneously recorded MIo and SIo neurons, respectively. PETHs are aligned to force onset (FO) and correspond to the first 20 trials. Mean ± SE force profiles corresponding to the same trials used to plot the PETHs. C, D, Population activity in MIo and SIo. Heat map depicting normalized firing rates (0–1) of each task-modulated MIo or SIo neuron (y-axis) of Monkeys Y and B, respectively. Each neuron's firing rates were normalized by the peak firing rate and aligned to FO. Neurons were sorted according to the time of peak firing such that the first row corresponded to the neuron whose peak activity occurred at the earliest before force onset. Data correspond to analysis day 5.
Figure 5.
Figure 5.
Cross-covariance functions between tongue-protrusive force and spiking activity of MIo and SIo neurons. A–C, Cross-covariance shown for single neurons in MIo and SIo across multiple days. Plots represent the correlation coefficients at specific lags. D, E, Distribution of lags when peak correlation between a neuron's spiking activity and tongue force occurred. Shown for MIo and SIo, respectively. Positive lags correspond to neuron leading force. Distribution modes were characterized using a mixture of Gaussians model and an expectation–maximization clustering algorithm. Data pooled across monkeys. M, Mean; R, correlation coefficient between the actual data and the model of a mixture of Gaussians. F, G, Mapping of task-modulated MIo neurons onto the electrode array. Each dot indicates a neuron with peak correlation at lags ranging from −0.5 to 0.5 s. Shown for each monkey. The position of the array relative to the central sulcus was marked on the array's border. Shaded green area represents the area proximal to central sulcus.
Figure 6.
Figure 6.
Short-term changes in the proportion of task-modulated neurons and firing rate variability. A, B, Success rates as a function of trial blocks (i.e., 50 trial sliding window moving in 25 trial steps) ordered from the beginning to the end of each training session. Shown separately for Monkeys B and Y. Lines correspond to a linear fit on the data. C, D, Success rates, Fano factor, and the number of modulated MIo and SIo neurons in the movement epoch, respectively, plotted as a function of trial blocks. Shown for one dataset of Monkey Y. E, F, Correlation between success rates and the proportion of task-modulated MIo and SIo neurons, respectively, during the preparatory and movement epochs. Shown as pooled data across the monkeys for all analysis days. R, Pearson's correlation coefficient. Lines correspond to a linear fit on the data. G, H, As in E, F, respectively, showing correlation between success rates and Fano factor. There are different scales used for the Fano factor corresponding to the preparatory and movement epochs.
Figure 7.
Figure 7.
Changes in the proportion of task-modulated neurons with adaptation. A, Sample proportion of MIo neurons modulated during the preparatory and movement epochs across analysis days. Shown as pooled data across the monkeys. B, As in A for SIo neurons. Error bars indicate SE. *p < 0.05 (binomial test). The proportions corresponding to the preparatory epoch of pre-training day were excluded.
Figure 8.
Figure 8.
MuI between the tongue-protrusive force and spiking activity of task-modulated neurons in MIo and SIo. A, B, Mean MuI of MIo neurons of Monkeys Y and B, respectively. Data aligned to force onset (FO). Shown for analysis days 1–5 and as mean across the last 50 trials of each analysis day. MuI of a single MIo neuron shown in A (inset). C, D, As in A, B, respectively, shown for SIo neurons. MuI of a single SIo neuron shown in C (inset). E, F, Tongue-protrusive force from 1 s before FO to 1 s after. Shown as mean across the last 50 trials of each analysis day.
Figure 9.
Figure 9.
MuI and reaction times. A, B, Mean MuI between tongue-protrusive force and spiking activity of MIo neurons aligned to target onset (0 s). Shown separately for each monkey. C, D, As in A, B, respectively, for SIo neurons. E, F, Correlation between reaction times and MuI slopes for MIo and SIo, respectively. p values correspond to t test on the Pearson correlation. R, Correlation coefficient.
Figure 10.
Figure 10.
Mean-matched Fano factor for neuronal data aligned to target onset. A, Daily Fano factor of MIo neurons from each monkey separately. Shown as medians (central mark) from target onset to 1 s after target onset. Box edges correspond to the 25th and 75th percentiles. p values correspond to Kruskal–Wallis test. B, As in A for SIo neurons.
Figure 11.
Figure 11.
Spike–spike coherence. A, Example of coherent activity between a neuronal pair in MIo during the first and late 50 trials. Shown from 0.5 s before force onset (FO) to 0.5 s after FO. B, As in A for a neuronal pair in SIo. C, D, All neuronal pairs in MIo and SIo that modulated their coherent activity during a session. Shown for each area and monkey. Each row represents the coherent activity of a neuronal pair from 0.5 s before FO to 0.5 s after FO. Color bar represents magnitude of coherence of a neuronal pair.
Figure 12.
Figure 12.
Transient changes in spike–spike coherence. A, Pairwise coherence of a subset of stable MIo neurons (5 pairs) across multiple days. Each line plot corresponds to a neuron paired with neuron 58. Inset, Position of the neurons (represented by ID numbers) on the 10 × 10 microelectrode array grid (4 × 4 mm). Data from Monkey Y. B, Mean coherent activity of the population of neuronal pairs in MIo during the late 50 trials of each analysis day, shown for Monkeys Y and B. C, As in B for the population of neuronal pairs in SIo shown for Monkeys Y and B. B, C, Kruskal–Wallis, p < 0.000001.

Similar articles

Cited by

References

    1. Abbott LF, Song S. Temporally asymmetric Hebbian learning, spike timing and neuronal response variability. In: Kearns MS, Solla SA, Cohn DA, editors. Advances in neural information processing systems. Ed 11. Cambridge, MA: Massachusetts Institute of Technology; 1999.
    1. Adibi M, McDonald JS, Clifford CW, Arabzadeh E. Adaptation improves neural coding efficiency despite increasing correlations in variability. J Neurosci. 2013;33:2108–2120. doi: 10.1523/JNEUROSCI.3449-12.2013. - DOI - PMC - PubMed
    1. Aertsen A, Vaadia E, Abeles M, Ahissar E, Bergman H, Karmon B, Lavner Y, Margalit E, Nelken I, Rotter S. Neural interactions in the frontal cortex of a behaving monkey: signs of dependence on stimulus context and behavioral state. J Hirnforsch. 1991;32:735–743. - PubMed
    1. Arce FI, Lee JC, Ross CF, Sessle BJ, Hatsopoulos NG. Directional information from neuronal ensembles in the primate orofacial sensorimotor cortex. J Neurophysiol. 2013;110:1357–1369. doi: 10.1152/jn.00144.2013. - DOI - PubMed
    1. Arce F, Novick I, Mandelblat-Cerf Y, Israel Z, Ghez C, Vaadia E. Combined adaptiveness of specific motor cortical ensembles underlies learning. J Neurosci. 2010a;30:5415–5425. doi: 10.1523/JNEUROSCI.0076-10.2010. - DOI - PMC - PubMed

Publication types

LinkOut - more resources