. 2014 Apr 23;34(17):6112-22.
doi: 10.1523/JNEUROSCI.5212-13.2014.

HDAC1 and HDAC2 control the specification of neural crest cells into peripheral glia

Affiliations

HDAC1 and HDAC2 control the specification of neural crest cells into peripheral glia

Claire Jacob et al. J Neurosci. .

Abstract

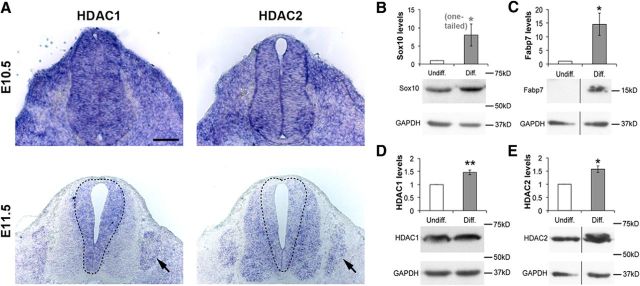
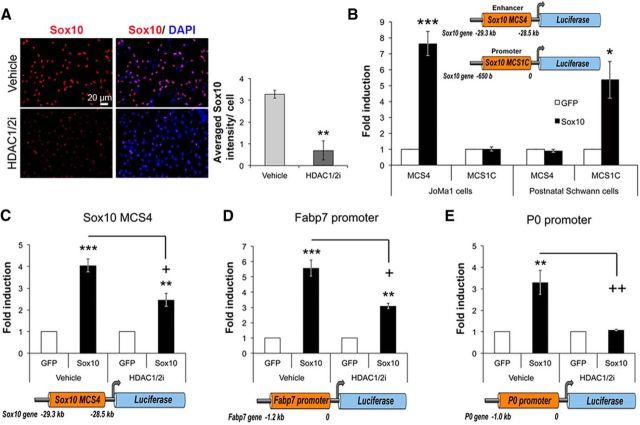
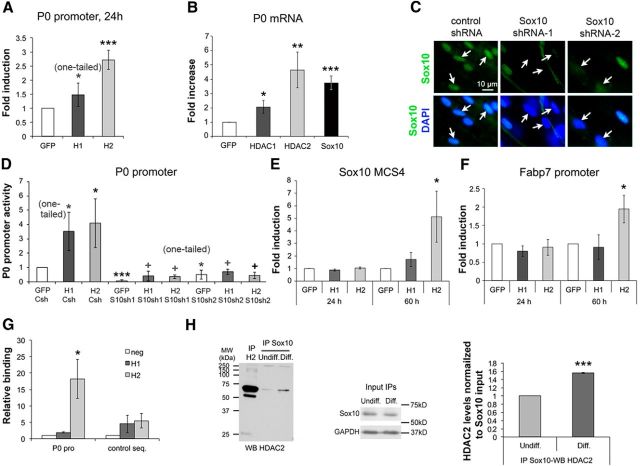
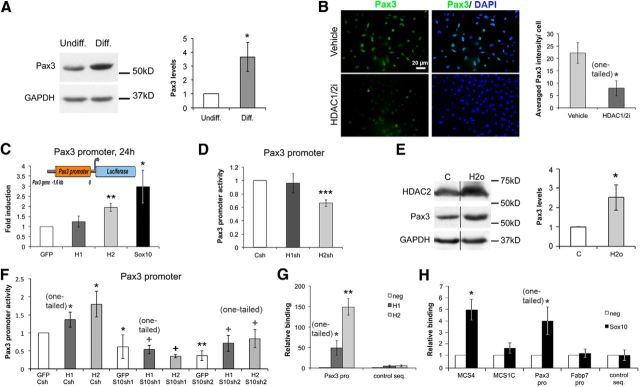
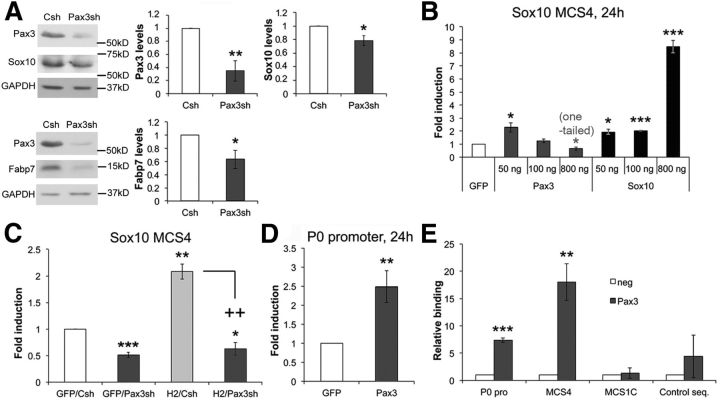
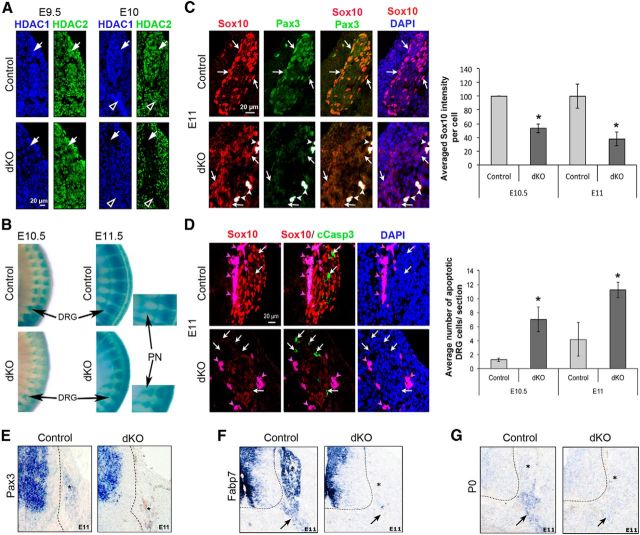
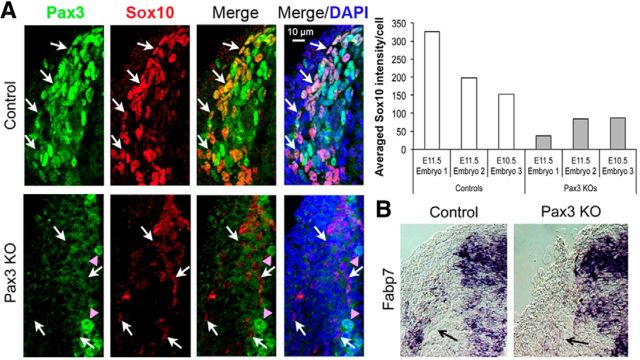
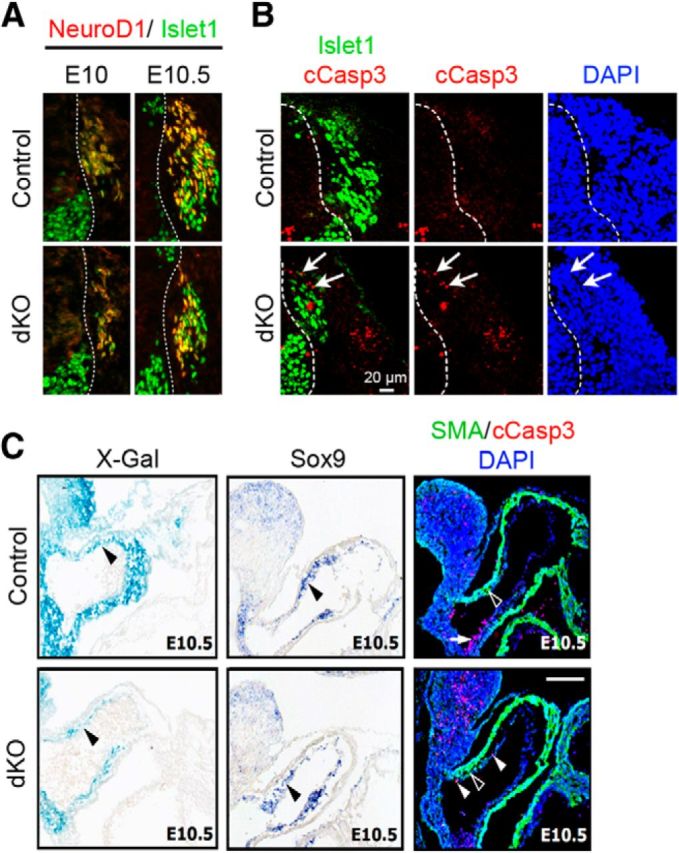
Schwann cells, the myelinating glia of the peripheral nervous system (PNS), originate from multipotent neural crest cells that also give rise to other cells, including neurons, melanocytes, chondrocytes, and smooth muscle cells. The transcription factor Sox10 is required for peripheral glia specification. However, all neural crest cells express Sox10 and the mechanisms directing neural crest cells into a specific lineage are poorly understood. We show here that histone deacetylases 1 and 2 (HDAC1/2) are essential for the specification of neural crest cells into Schwann cell precursors and satellite glia, which express the early determinants of their lineage myelin protein zero (P0) and/or fatty acid binding protein 7 (Fabp7). In neural crest cells, HDAC1/2 induced expression of the transcription factor Pax3 by binding and activating the Pax3 promoter. In turn, Pax3 was required to maintain high Sox10 levels and to trigger expression of Fabp7. In addition, HDAC1/2 were bound to the P0 promoter and activated P0 transcription. Consistently, in vivo genetic deletion of HDAC1/2 in mouse neural crest cells led to strongly decreased Sox10 expression, no detectable Pax3, virtually no satellite glia, and no Schwann cell precursors in dorsal root ganglia and peripheral nerves. Similarly, in vivo ablation of Pax3 in the mouse neural crest resulted in strongly reduced expression of Sox10 and Fabp7. Therefore, by controlling the expression of Pax3 and the concerted action of Pax3 and Sox10 on their target genes, HDAC1/2 direct the specification of neural crest cells into peripheral glia.

Keywords: histone deacetylases; neural crest cells; peripheral glia specification; transcriptional control.


Figures

Figure 1.
Figure 1.
HDAC1/2 are robustly expressed in DRG and upregulated in JoMa1 neural crest cells during specification into glia. A, In situ hybridization of Hdac1 and Hdac2 on transverse neural tube sections of E10.5 and E11.5 wild-type mouse embryos (representative pictures of three embryos analyzed). Arrows indicate DRG. Scale bar, 100 μm. Western blot pictures of Sox10 (B), Fabp7 (C), HDAC1 (D), and HDAC2 (E) and quantification normalized to GAPDH in 4 d differentiated (Diff.) versus undifferentiated (Undiff. = 1) JoMa1 cells. Dividing lines indicate that samples have been loaded on the same gel, but not on consecutive lanes. p-values (two-tailed paired Student's t test unless stated otherwise in the figure): 0.0418 (B), 0.0157 (C), 0.0026 (D), 0.011 (E). Results are from at least three independent experiments. Error bars indicate SEM.
Figure 2.
Figure 2.
HDAC1/2 activity is required to maintain high Sox10 levels and for Sox10-dependent activation of Sox10, Fabp7 and P0 gene regulatory regions during specification into glia. A, Immunofluorescence of Sox10 (red; DAPI = nuclei in blue) on mouse neural crest explants in differentiating conditions with or without the HDAC1/2 inhibitor mocetinostat (HDAC1/2i; 0.6 μm), and quantification of Sox10 (200 cells per explant, 3 explants per condition, n = 3). Relative luciferase activity of Sox10 MCS4 (B,C), Sox10 MCS1C (= Sox10 promoter region, B), Fabp7 promoter (D), and P0 promoter (E)-driven luciferase reporter constructs (-luc) induced by Sox10 overexpression compared with GFP (= 1) with or without HDAC1/2i (CE) 24 h after transfection and induction of differentiation in postnatal primary rat Schwann cells (B) or in JoMa1 cells (BE). p-values from two-tailed unpaired (A) or paired (BE) Student's t test: 0.0063 (A); *0.0193, ***6.91462E-06 (B); **0.0029, ***0.0001, +0.026 (C); **1.00025E-05, ***0.0001, +0.017 (D); and **0.0041, ++0.028 (E). Results are from at least three independent experiments. Error bars indicate SEM.
Figure 3.
Figure 3.
HDAC2 binds to and activates the P0 promoter, whereas HDAC2-dependent activation of Sox10 MCS4 and the Fabp7 promoter is most likely indirect. Relative luciferase activity of P0 promoter-luc (A, D), Sox10 MCS4-luc (E), and Fabp7 promoter-luc (F) by HDAC1 (H1) or HDAC2 (H2) overexpression with or without Sox10 shRNAs (S10sh; D) or in the presence of Sox10 shRNAs alone (D) compared with GFP (= 1) or GFP/Control shRNA (GFP/Csh = 1), 24 h (A) or 24 and 60 h (E, F) after transfection and induction of differentiation or 72 h (D) after transfection and 24 h in differentiating conditions. B, Fold increase of P0 mRNA induced by HDAC1, HDAC2, or Sox10 overexpression compared with GFP (= 1) and normalized to GAPDH mRNA 48 h after transfection and induction of differentiation. C, Immunofluorescence of Sox10 (green) and DAPI (blue = nuclei) labeling of mouse DRG explant cultures 3 d after transfection with control shRNA, Sox10 shRNA-1, and Sox10 shRNA-2 constructs. G, ChIP of HDAC1 (H1) and HDAC2 (H2) to P0 promoter (P0 pro) or control sequence (control seq.) compared with negative control (IgG = neg = 1). H, Immunoprecipitation of HDAC2 or Sox10 in undifferentiated or 24 h differentiated JoMa1 cells and Western blot for HDAC2. Quantification of coimmunoprecipitated HDAC2 normalized to Sox10 input. p-values (two-tailed paired Student's t test, unless stated otherwise): *0.041 and ***0.00046 (A); *0.042, **0.0058, ***8.4726E-05 (B); *0.037, 0.041, 0.03, ***0.00004 (D, p-values compared with the control GFP/Csh), +0.044, 0.031, 0.029, 0.029 (D, p-values compared with H1/Csh for H1/S10sh or H2/Csh for H2/S10sh); *0.044 (E); 0.03 (F); 0.044 (G); and ***0.0007 (H). Results are from at least three independent experiments. Error bars indicate SEM.
Figure 4.
Figure 4.
HDAC2 controls Pax3 expression in neural crest cells. A, Western blot of Pax3 and quantification normalized to GAPDH in 4 d differentiated (Diff.) compared with undifferentiated (Undiff. = 1) JoMa1 cells. B, Immunofluorescence of Pax3 (green; DAPI = nuclei in blue) in neural crest explants in differentiating conditions with or without the HDAC1/2 inhibitor mocetinostat (HDAC1/2i, 0.6 μm) and quantification of Pax3 (∼200 cells per explant, 3 explants per condition, n = 3). Relative luciferase activity of Pax3 promoter-luc upon HDAC1 (H1), HDAC2 (H2) or Sox10 overexpression (C) with or without Sox10 shRNAs (S10sh) or in the presence of Sox10 shRNAs alone (F) compared with GFP (= 1) or GFP/control shRNA (GFP/Csh = 1) 24 or 72 h (shRNA) after transfection and 24 h of induction of differentiation or in the presence of H1 shRNA (sh) or H2sh compared with Csh (= 1) (D) 72 h after transfection and 24 h in differentiating conditions. E, Western blot of HDAC2, Pax3, and GAPDH in JoMa1 cells expressing endogenous HDAC2 (C, control) or overexpressing HDAC2 (H2o). A lentiviral vector was used to overexpress HDAC2. Control cells were transduced with a lentiviral vector expressing GFP. Cells were collected 72 h after transduction and induction of differentiation. Dividing lines indicate that samples have been loaded on the same gel, but not on consecutive lanes. G, ChIP showing relative binding of anti-HDAC1 (H1) and anti-HDAC2 (H2) antibodies to Pax3 promoter (Pax3 pro) or control sequence (control seq.) compared with negative control (IgG = neg = 1). H, ChIP showing relative binding of anti-Sox10 antibody to Sox10 MCS4, Sox10 MCS1C, Pax3 promoter (pro), Fabp7 pro, or control sequence region (control seq.) compared with negative control (IgG = neg = 1), 24 h after induction of differentiation. p-values from Student's t test (two-tailed paired in A, C, D, EH or unpaired in B) unless stated otherwise: 0.044 (A); 0.025 (B); *0.041, **0.0016 (C); 0.0003 (D); 0.04 (E); *0.047, 0.031, 0.048, **0.0032 (F, p-values compared with control GFP/Csh), +0.026, 0.04, 0.028, 0.027 (F, p-values compared with H1/Csh for H1/S10sh or to H2/Csh for H2/S10sh); *0.027 and **0.0019 (G); 0.033 (one-tailed) and 0.0125 (two-tailed; H). Results are from at least three independent experiments. Error bars indicate SEM.
Figure 5.
Figure 5.
Pax3 controls glial marker and regulator expression during specification. A, Pax3, Sox10, and Fabp7 Western blots and quantification normalized to GAPDH in JoMa1 cells 6 d after transduction with control shRNA (Csh = 1) or Pax3 shRNA (Pax3sh) lentiviruses and 4 d in differentiating conditions. Luciferase fold induction of Sox10 MCS4-luc in JoMa1 cells (B) transfected with increasing amounts of Pax3 or Sox10 compared with GFP (= 1) 24 h after transfection in differentiating conditions or expressing endogenous or overexpressed HDAC2 (H2) with or without Pax3sh (C) compared with GFP/Csh (= 1) 96 h after transfection and 48 h in differentiating conditions. D, Luciferase fold induction of P0 promoter-luc by Pax3 overexpression compared with GFP (= 1) 24 h after transfection in differentiating conditions. E, ChIP of Pax3 to P0 promoter (P0 pro), Sox10 MCS4, Sox10 MCS1C, or control sequence (control seq.) compared with negative control (IgG = neg = 1). p-values (one-tailed or two-tailed paired Student's t test): *0.03, 0.048, **0.0067 (A, one-tailed); *0.0277 (B, one-tailed); *0.0197, 0.0166, ***4.953E-05, 6.91E-6 (B, two-tailed); *0.0355, **0.0016, ***0.0006, ++0.009 (C, two-tailed); 0.008 (D, two-tailed); **0.0079, ***0.0001 (E, two-tailed). Results are from at least three independent experiments. Error bars indicate SEM.
Figure 6.
Figure 6.
HDAC1/2 are essential for in vivo specification of peripheral glia. A, Coimmunofluorescence of HDAC1 (blue) and HDAC2 (green) in E9.5 and E10 dKO DRG and peripheral nerves. White arrows indicate DRG and arrowheads peripheral nerves. Three control and three dKO embryos for each age were stained and representative photographs are shown. B, Whole-mount in vivo fate mapping using the recombination-dependent Rosa26-lacZ reporter allele at E10.5 and E11.5. Spinal cords imaged at the same level in control and dKO embryos are shown. Insets on the right are a magnification of two E11.5 DRG and their peripheral nerve (PN). Arrows show DRG or PN, as indicated in the figure. C, Confocal pictures (z-series projections) of Sox10 (red) and Pax3 (green) coimmunofluorescence and DAPI labeling (= nuclei in blue) in E11 control and HDAC1/2 dKO DRG, and Sox10 quantification at E10.5 and E11 (Sox10-expressing cells in DRG of 3 controls and 3 dKOs for each developmental stage). Overlay of Sox10 and Pax3 appears yellow, and of Sox10 and DAPI appears pink. Arrows indicate some Sox10-expressing cells, arrowheads some nonspecific auto-fluorescence (white). D, Confocal pictures of Sox10 (red) and cleaved Caspase 3 (cCasp3, green) coimmunofluorescence and DAPI labeling (blue) in E11 control and HDAC1/2 dKO DRG, and quantification of apoptotic cells (cCasp3-positive) in DRG at E10.5 and E11 (3 controls and 3 dKOs for each developmental stage). White arrows show cCasp3-positive cells, pink arrowheads show nonspecific auto-fluorescence (magenta). In situ hybridization of Pax3 (E), Fabp7 (F), and P0 (G) in E11 controls and dKOs (representative pictures of 3 controls and 3 dKOs). Asterisks indicate DRG, arrows, peripheral nerves. p-value from two-tailed paired (C, E10.5) or unpaired (C, E11; D) Student's t test: *0.02, 0.037 (C); and *0.019, 0.038 (D). Error bar indicates SEM.
Figure 7.
Figure 7.
Sox10 and Fabp7 are strongly reduced in Wnt1-Cre Pax3 knock-out DRG. A, Confocal pictures (z-series projections) of Pax3 (green) and Sox10 (red) coimmunofluorescence, and DAPI (blue) labeling in E11.5 control and Pax3 KO DRG and Sox10 quantification (at least 100 Sox10-expressing cells quantified in DRG of two E11.5 and one E10.5 controls and two E11.5 and one E10.5 Pax3 KOs). When quantifications of all embryos are pooled, averaged Sox10 intensity per cell is significantly decreased by 70% in Pax3 KOs compared with controls (two-tailed unpaired Student's t test, p-value = 0.045). White arrows show some Sox10-positive cells; pink arrowheads, nonspecific auto-fluorescence signal. B, In situ hybridization of Fabp7 in E11.5 control and Pax3 KO embryos (representative photographs of two controls and two Pax3 KOs). Arrows indicate DRG.
Figure 8.
Figure 8.
In the absence of HDAC1/2, sensory neurons are specified and cardiac neural crest cells express differentiation markers. A, Confocal pictures of NeuroD1 (red) and Islet1 (green) coimmunofluorescence in E10 and E10.5 control and HDAC1/2 dKO DRG. Overlay of NeuroD1 and Islet1 appears yellow. B, Confocal pictures of Islet1 (green) and cCasp3 (red) coimmunofluorescence and DAPI (blue) labeling in E10.5 control and HDAC1/2 dKO DRG. White arrows indicate cCasp3-positive DRG cells. C, In vivo cell fate mapping by X-Gal staining (black arrowheads) using the recombination-dependent Rosa26-lacZ reporter allele, Sox9 in situ hybridization (black arrowheads), and SMA (green, open arrowheads), cCasp3 (red, white arrowheads) coimmunofluorescence, and DAPI (blue) labeling in E10.5 control and HDAC1/2 dKO heart outflow tract. The white arrow shows nonspecific auto-fluorescence signal. Scale bar, 100 μm. For each panel, representative photographs of three controls and three dKOs for each developmental stage are shown.

Similar articles

Cited by

References

    1. Antonellis A, Huynh JL, Lee-Lin SQ, Vinton RM, Renaud G, Loftus SK, Elliot G, Wolfsberg TG, Green ED, McCallion AS, Pavan WJ. Identification of neural crest and glial enhancers at the mouse Sox10 locus through transgenesis in zebrafish. PLoS Genet. 2008;4:e1000174. doi: 10.1371/journal.pgen.1000174. - DOI - PMC - PubMed
    1. Auerbach R. Analysis of the developmental effects of a lethal mutation in the house mouse. Journal of Experimental Zoology. 1954;127:305–329. doi: 10.1002/jez.1401270206. - DOI
    1. Britsch S, Goerich DE, Riethmacher D, Peirano RI, Rossner M, Nave KA, Birchmeier C, Wegner M. The transcription factor Sox10 is a key regulator of peripheral glial development. Genes Dev. 2001;15:66–78. doi: 10.1101/gad.186601. - DOI - PMC - PubMed
    1. Campeau E, Ruhl VE, Rodier F, Smith CL, Rahmberg BL, Fuss JO, Campisi J, Yaswen P, Cooper PK, Kaufman PD. A versatile viral system for expression and depletion of proteins in mammalian cells. PLoS One. 2009;4:e6529. doi: 10.1371/journal.pone.0006529. - DOI - PMC - PubMed
    1. Danielian PS, Muccino D, Rowitch DH, Michael SK, McMahon AP. Modification of gene activity in mouse embryos in utero by a tamoxifen-inducible form of Cre recombinase. Curr Biol. 1998;8:1323–1326. doi: 10.1016/S0960-9822(07)00562-3. - DOI - PubMed

Publication types

MeSH terms

LinkOut - more resources