

Structural analysis of respiratory syncytial virus reveals the position of M2-1 between the matrix protein and the ribonucleoprotein complex
- PMID: 24760890
- PMCID: PMC4054448
- DOI: 10.1128/JVI.00256-14
Structural analysis of respiratory syncytial virus reveals the position of M2-1 between the matrix protein and the ribonucleoprotein complex
Abstract
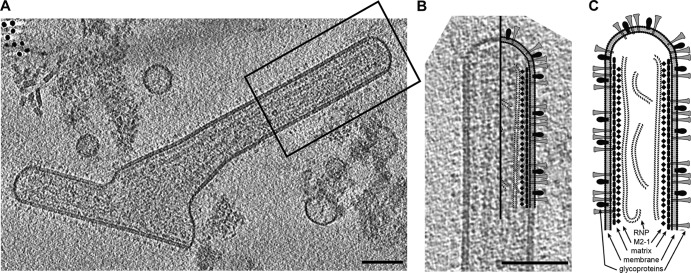
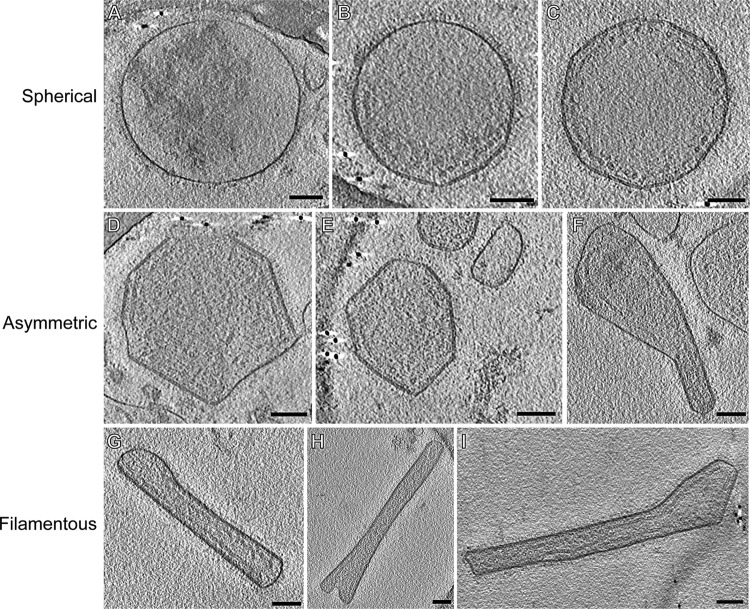
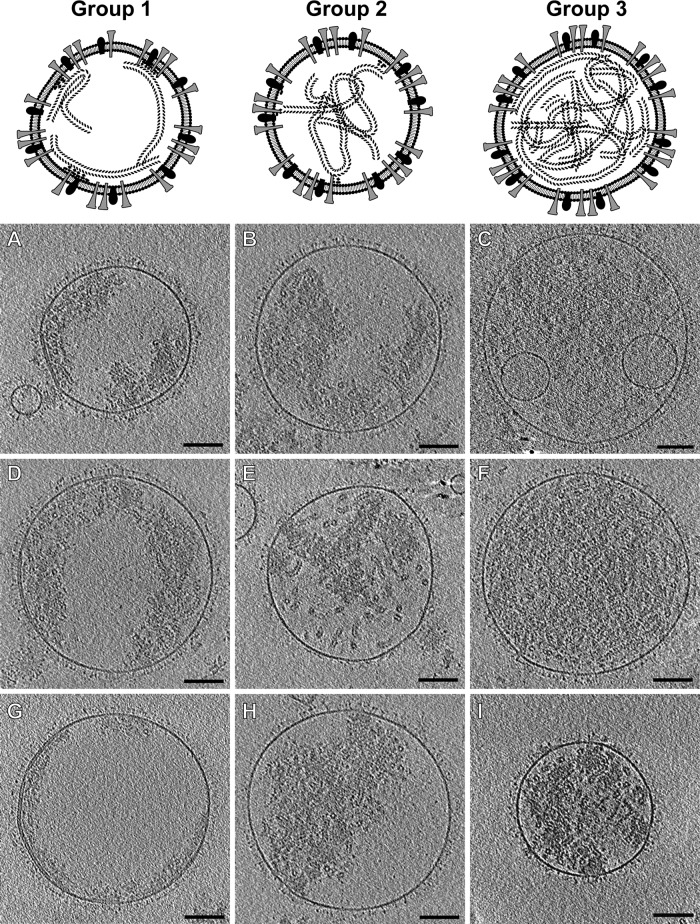
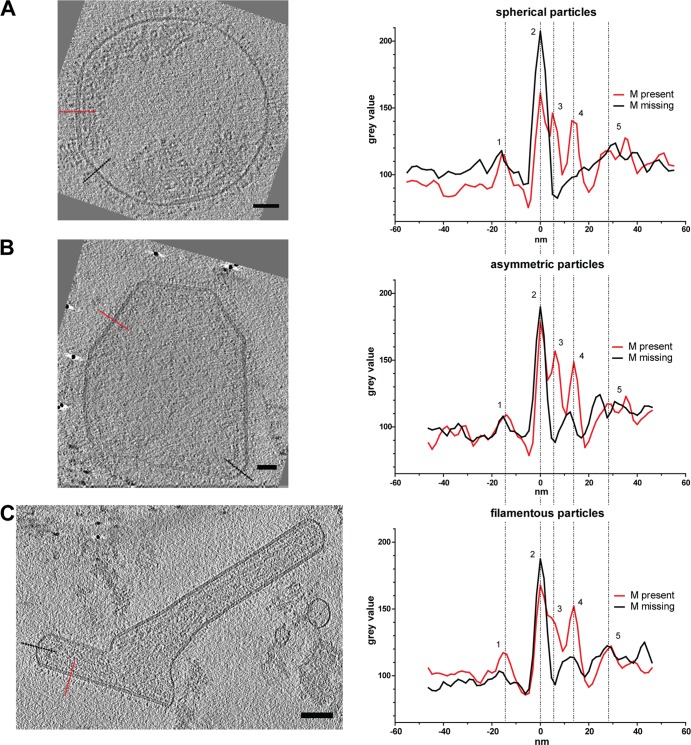
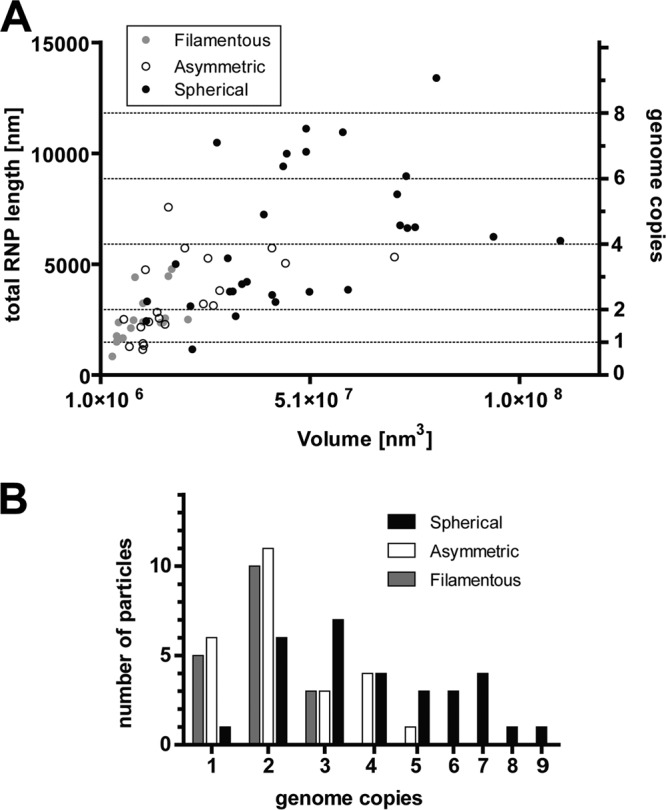
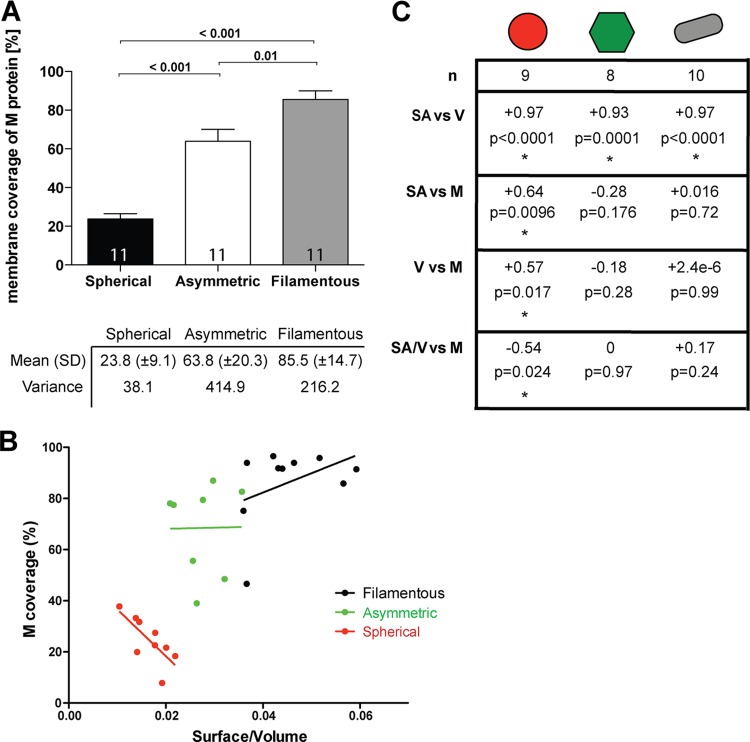
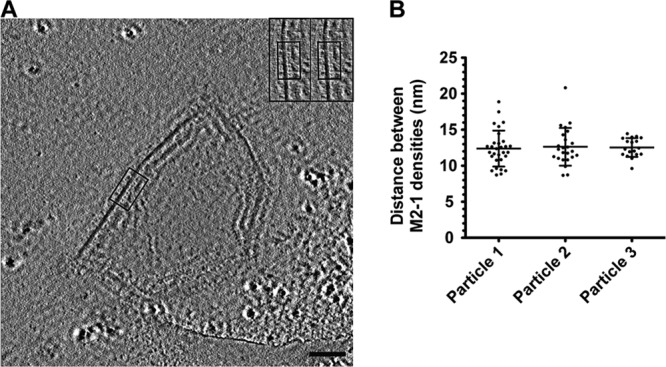
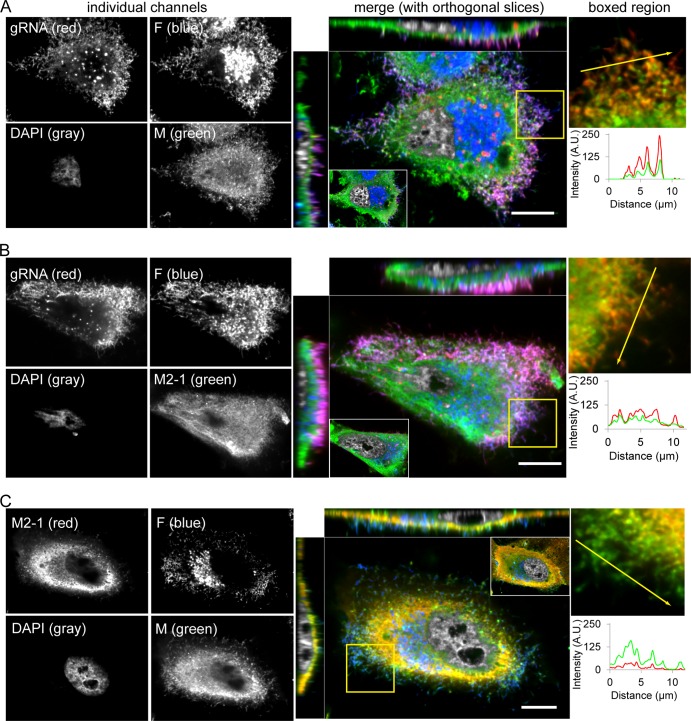
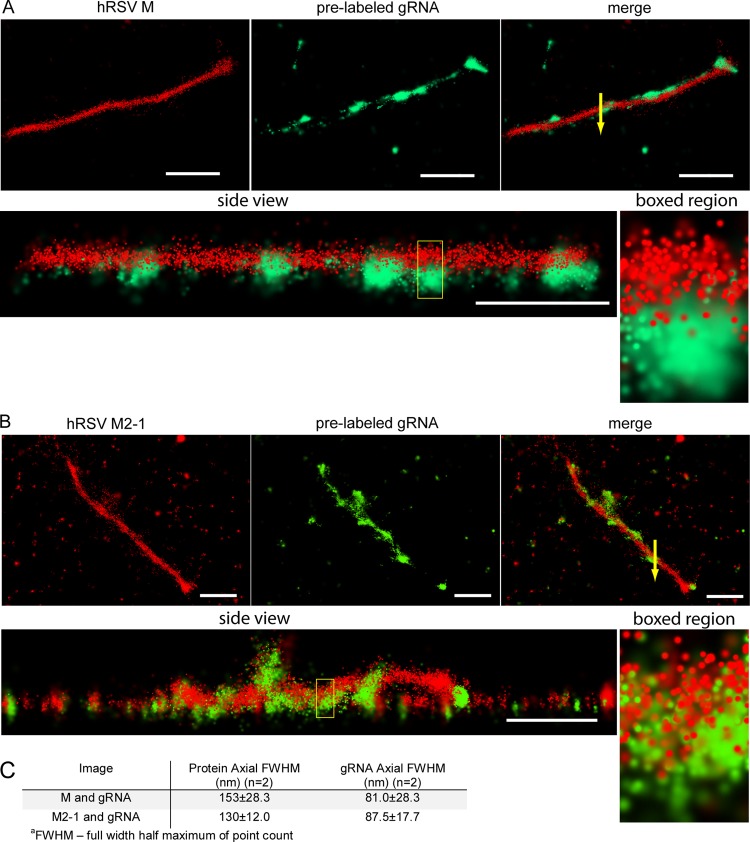
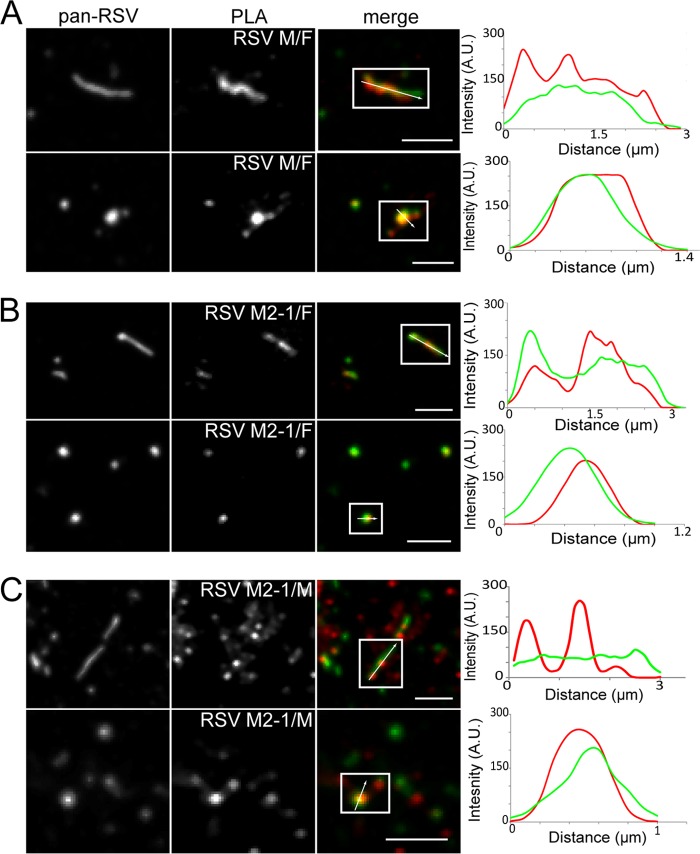
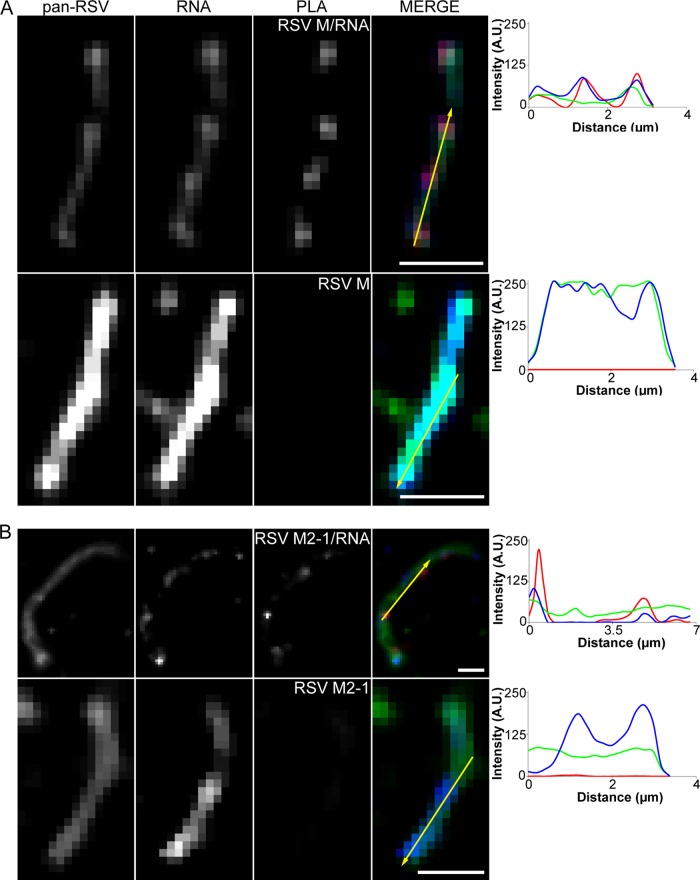
Respiratory syncytial virus (RSV), a member of the Paramyxoviridae family of nonsegmented, negative-sense, single-stranded RNA genome viruses, is a leading cause of lower respiratory tract infections in infants, young children, and the elderly or immunocompromised. There are many open questions regarding the processes that regulate human RSV (hRSV) assembly and budding. Here, using cryo-electron tomography, we identified virus particles that were spherical, filamentous, and asymmetric in structure, all within the same virus preparation. The three particle morphologies maintained a similar organization of the surface glycoproteins, matrix protein (M), M2-1, and the ribonucleoprotein (RNP). RNP filaments were traced in three dimensions (3D), and their total length was calculated. The measurements revealed the inclusion of multiple full-length genome copies per particle. RNP was associated with the membrane whenever the M layer was present. The amount of M coverage ranged from 24% to 86% in the different morphologies. Using fluorescence light microscopy (fLM), direct stochastic optical reconstruction microscopy (dSTORM), and a proximity ligation assay (PLA), we provide evidence illustrating that M2-1 is located between RNP and M in isolated viral particles. In addition, regular spacing of the M2-1 densities was resolved when hRSV viruses were imaged using Zernike phase contrast (ZPC) cryo-electron tomography. Our studies provide a more complete characterization of the hRSV virion structure and substantiation that M and M2-1 regulate virus organization.
Importance: hRSV is a leading cause of lower respiratory tract infections in infants and young children as well as elderly or immunocompromised individuals. We used cryo-electron tomography and Zernike phase contrast cryo-electron tomography to visualize populations of purified hRSV in 3D. We observed the three distinct morphologies, spherical, filamentous, and asymmetric, which maintained comparable organizational profiles. Depending on the virus morphology examined, the amount of M ranged from 24% to 86%. We complemented the cryo-imaging studies with fluorescence microscopy, dSTORM, and a proximity ligation assay to provide additional evidence that M2-1 is incorporated into viral particles and is positioned between M and RNP. The results highlight the impact of M and M2-1 on the regulation of hRSV organization.
Copyright © 2014, American Society for Microbiology. All Rights Reserved.
Figures
Similar articles
-
The Morphology and Assembly of Respiratory Syncytial Virus Revealed by Cryo-Electron Tomography.Viruses. 2018 Aug 20;10(8):446. doi: 10.3390/v10080446. Viruses. 2018. PMID: 30127286 Free PMC article.
-
A critical phenylalanine residue in the respiratory syncytial virus fusion protein cytoplasmic tail mediates assembly of internal viral proteins into viral filaments and particles.mBio. 2012 Feb 7;3(1):e00270-11. doi: 10.1128/mBio.00270-11. Print 2012. mBio. 2012. PMID: 22318318 Free PMC article.
-
Decoding respiratory syncytial virus morphology: distinct structural and molecular signatures of spherical and filamentous particles.Front Cell Infect Microbiol. 2025 May 27;15:1597279. doi: 10.3389/fcimb.2025.1597279. eCollection 2025. Front Cell Infect Microbiol. 2025. PMID: 40496018 Free PMC article.
-
Structural Insights into the Respiratory Syncytial Virus RNA Synthesis Complexes.Viruses. 2021 May 5;13(5):834. doi: 10.3390/v13050834. Viruses. 2021. PMID: 34063087 Free PMC article. Review.
-
Modulation of Host Immunity by Human Respiratory Syncytial Virus Virulence Factors: A Synergic Inhibition of Both Innate and Adaptive Immunity.Front Cell Infect Microbiol. 2017 Aug 16;7:367. doi: 10.3389/fcimb.2017.00367. eCollection 2017. Front Cell Infect Microbiol. 2017. PMID: 28861397 Free PMC article. Review.
Cited by
-
Structure of the Human Respiratory Syncytial Virus M2-1 Protein in Complex with a Short Positive-Sense Gene-End RNA.Structure. 2020 Sep 1;28(9):979-990.e4. doi: 10.1016/j.str.2020.07.001. Epub 2020 Jul 21. Structure. 2020. PMID: 32697936 Free PMC article.
-
Contribution of Nanotechnologies to Vaccine Development and Drug Delivery against Respiratory Viruses.PPAR Res. 2021 Oct 27;2021:6741290. doi: 10.1155/2021/6741290. eCollection 2021. PPAR Res. 2021. PMID: 34721558 Free PMC article. Review.
-
Tetramerization of Phosphoprotein is Essential for Respiratory Syncytial Virus Budding while its N Terminal Region Mediates Direct Interactions with the Matrix Protein.J Virol. 2021 Mar 10;95(7):e02217-20. doi: 10.1128/JVI.02217-20. Epub 2021 Jan 6. J Virol. 2021. PMID: 33408180 Free PMC article.
-
Dynamic Viral Glycoprotein Machines: Approaches for Probing Transient States That Drive Membrane Fusion.Viruses. 2016 Jan 11;8(1):15. doi: 10.3390/v8010015. Viruses. 2016. PMID: 26761026 Free PMC article. Review.
-
Integrating immunoinformatics and computational epitope prediction for a vaccine candidate against respiratory syncytial virus.Infect Dis Model. 2024 Apr 16;9(3):763-774. doi: 10.1016/j.idm.2024.04.005. eCollection 2024 Sep. Infect Dis Model. 2024. PMID: 38708060 Free PMC article.
References
-
- Lamb RA, Parks GD. 2007. Paramyxoviridae: the viruses and their replication, p 1449–1496 In Knipe DMH, Peter M. (ed), Fields virology, 5th ed, vol 2 Lippincott Williams & Wilkins, Philadelphia, PA
-
- Nair H, Verma VR, Theodoratou E, Zgaga L, Huda T, Simoes EA, Wright PF, Rudan I, Campbell H. 2011. An evaluation of the emerging interventions against respiratory syncytial virus (RSV)-associated acute lower respiratory infections in children. BMC Public Health 11(Suppl 3):S30. 10.1186/1471-2458-11-S3-S30 - DOI - PMC - PubMed
-
- Lozano R, Naghavi M, Foreman K, Lim S, Shibuya K, Aboyans V, Abraham J, Adair T, Aggarwal R, Ahn SY, Alvarado M, Anderson HR, Anderson LM, Andrews KG, Atkinson C, Baddour LM, Barker-Collo S, Bartels DH, Bell ML, Benjamin EJ, Bennett D, Bhalla K, Bikbov B, Bin Abdulhak A, Birbeck G, Blyth F, Bolliger I, Boufous S, Bucello C, Burch M, Burney P, Carapetis J, Chen H, Chou D, Chugh SS, Coffeng LE, Colan SD, Colquhoun S, Colson KE, Condon J, Connor MD, Cooper LT, Corriere M, Cortinovis M, de Vaccaro KC, Couser W, Cowie BC, Criqui MH, Cross M, Dabhadkar KC, et al. 2012. Global and regional mortality from 235 causes of death for 20 age groups in 1990 and 2010: a systematic analysis for the Global Burden of Disease Study 2010. Lancet 380:2095–2128. 10.1016/S0140-6736(12)61728-0 - DOI - PMC - PubMed
Publication types
MeSH terms
Substances
Grants and funding
LinkOut - more resources
Full Text Sources
Other Literature Sources
Molecular Biology Databases
