

Toll-like receptor 2-mediated innate immune responses against Junín virus in mice lead to antiviral adaptive immune responses during systemic infection and do not affect viral replication in the brain
- PMID: 24760892
- PMCID: PMC4097793
- DOI: 10.1128/JVI.00050-14
Toll-like receptor 2-mediated innate immune responses against Junín virus in mice lead to antiviral adaptive immune responses during systemic infection and do not affect viral replication in the brain
Abstract
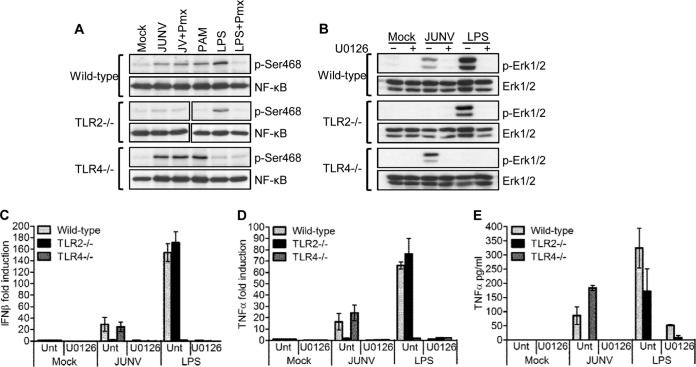
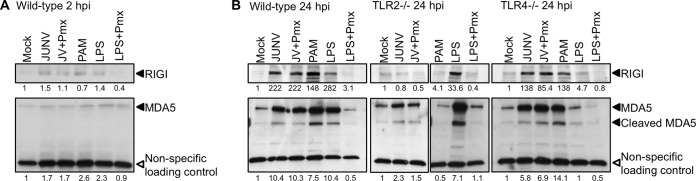
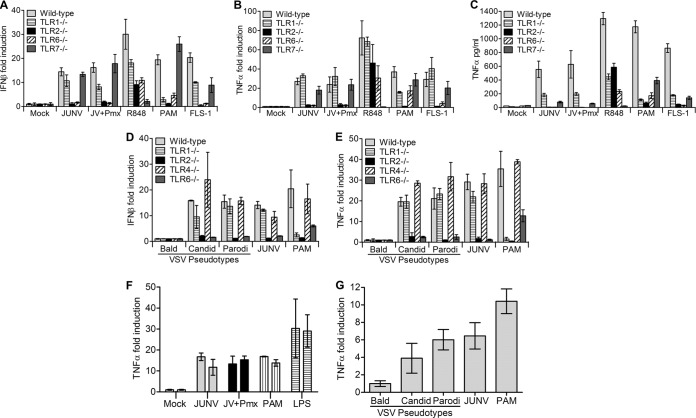
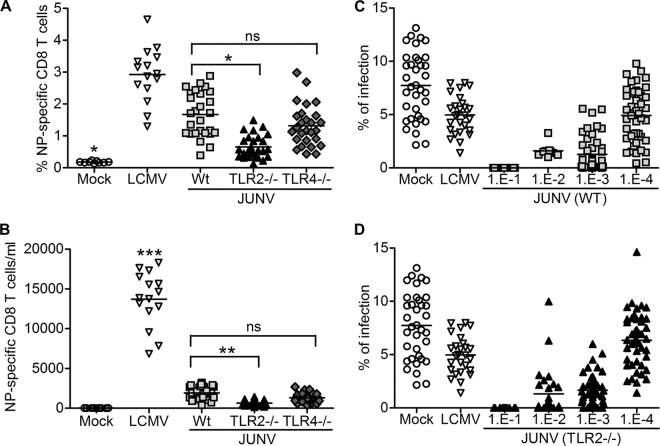
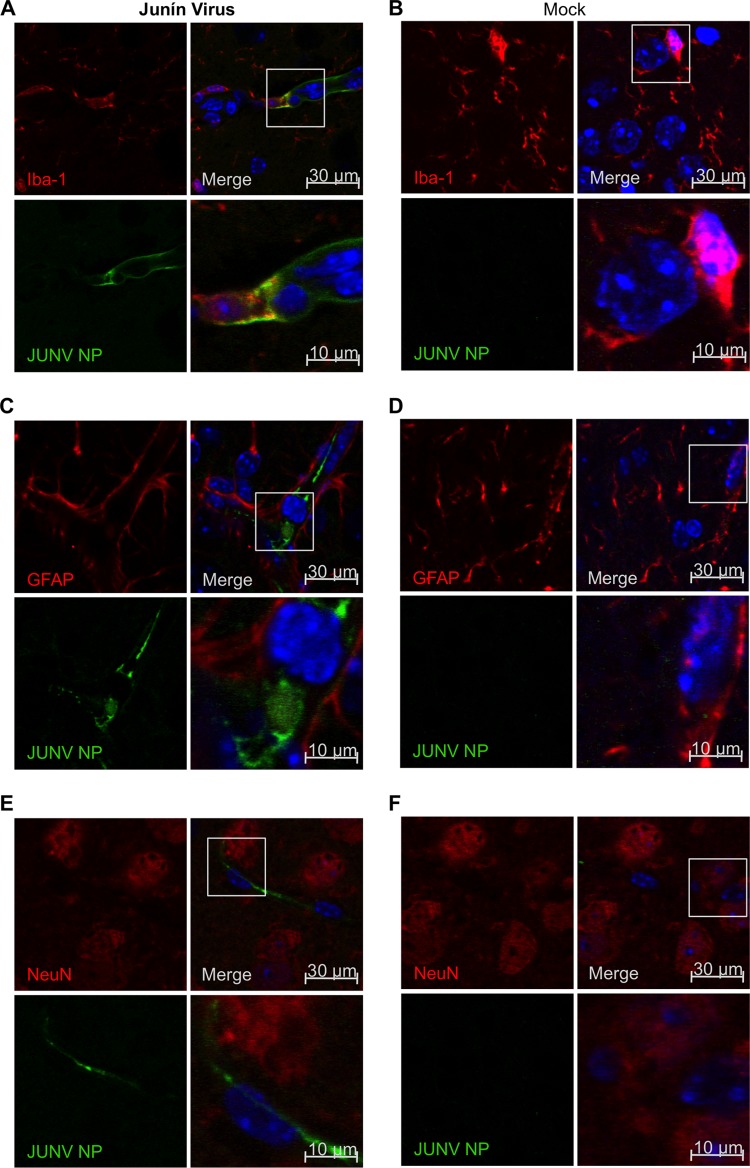
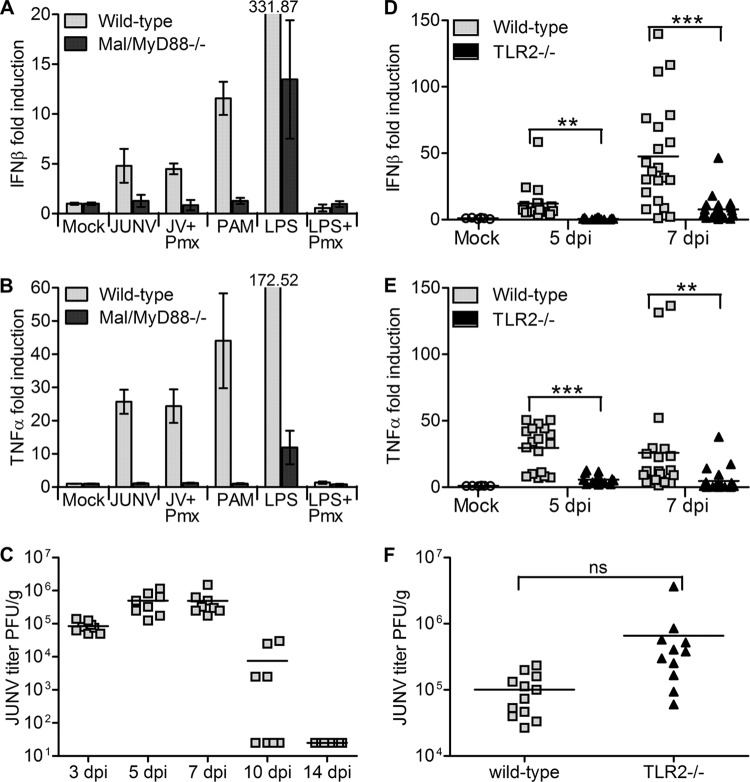
Successful adaptive immunity to virus infection often depends on the initial innate response. Previously, we demonstrated that Junín virus, the etiological agent responsible for Argentine hemorrhagic fever (AHF), activates an early innate immune response via an interaction between the viral glycoprotein and Toll-like receptor 2 (TLR2). Here we show that TLR2/6 but not TLR1/2 heterodimers sense Junín virus glycoprotein and induce a cytokine response, which in turn upregulates the expression of the RNA helicases RIG-I and MDA5. NF-κB and Erk1/2 were important in the cytokine response, since both proteins were phosphorylated as a result of the interaction of virus with TLR2, and treatment with an Erk1/2-specific inhibitor blocked cytokine production. We show that the Junín virus glycoprotein activates cytokine production in a human macrophage cell line as well. Moreover, we show that TLR2-mediated immune response plays a role in viral clearance because wild-type mice cleared Candid 1 (JUNV C1), the vaccine strain of Junín virus, more rapidly than did TLR2 knockout mice. This clearance correlated with the generation of Junín virus-specific CD8(+) T cells. However, infected wild-type and TLR2 knockout mice developed TLR2-independent blocking antibody responses with similar kinetics. We also show that microglia and astrocytes but not neurons are susceptible to infection with JUNV C1. Although JUNV C1 infection of the brain also triggered a TLR2-dependent cytokine response, virus levels were equivalent in wild-type and TLR2 knockout mice. Importance: Junín virus is transmitted by rodents native to Argentina and is associated with both systemic disease and, in some patients, neurological symptoms. Humans become infected when they inhale aerosolized Junín virus. AHF has a 15 to 30% mortality rate, and patients who clear the infection develop a strong antibody response to Junín virus. Here we investigated what factors determine the immune response to Junín virus. We show that a strong initial innate immune response to JUNV C1 determines how quickly mice can clear systemic infection and that this depended on the cellular immune response. In contrast, induction of an innate immune response in the brain had no effect on virus infection levels. These findings may explain how the initial immune response to Junín virus infection could determine different outcomes in humans.
Copyright © 2014, American Society for Microbiology. All Rights Reserved.
Figures
Similar articles
-
Junin virus infects mouse cells and induces innate immune responses.J Virol. 2011 Nov;85(21):11058-68. doi: 10.1128/JVI.05304-11. Epub 2011 Aug 31. J Virol. 2011. PMID: 21880772 Free PMC article.
-
Junín virus infection activates the type I interferon pathway in a RIG-I-dependent manner.PLoS Negl Trop Dis. 2012;6(5):e1659. doi: 10.1371/journal.pntd.0001659. Epub 2012 May 22. PLoS Negl Trop Dis. 2012. PMID: 22629479 Free PMC article.
-
Guinea Pig Transferrin Receptor 1 Mediates Cellular Entry of Junín Virus and Other Pathogenic New World Arenaviruses.J Virol. 2020 Jan 31;94(4):e01278-19. doi: 10.1128/JVI.01278-19. Print 2020 Jan 31. J Virol. 2020. PMID: 31748396 Free PMC article.
-
Junín virus pathogenesis and virus replication.Viruses. 2012 Oct 19;4(10):2317-39. doi: 10.3390/v4102317. Viruses. 2012. PMID: 23202466 Free PMC article. Review.
-
The Virus-Host Interplay in Junín Mammarenavirus Infection.Viruses. 2022 May 24;14(6):1134. doi: 10.3390/v14061134. Viruses. 2022. PMID: 35746604 Free PMC article. Review.
Cited by
-
Integrated Functional Analysis of the Nuclear Proteome of Classically and Alternatively Activated Macrophages.Mediators Inflamm. 2019 Apr 30;2019:3481430. doi: 10.1155/2019/3481430. eCollection 2019. Mediators Inflamm. 2019. PMID: 31182931 Free PMC article.
-
A Review of Human Coronaviruses' Receptors: The Host-Cell Targets for the Crown Bearing Viruses.Molecules. 2021 Oct 26;26(21):6455. doi: 10.3390/molecules26216455. Molecules. 2021. PMID: 34770863 Free PMC article. Review.
-
Spatial Organization of Dectin-1 and TLR2 during Synergistic Crosstalk Revealed by Super-resolution Imaging.J Phys Chem B. 2022 Aug 11;126(31):5781-5792. doi: 10.1021/acs.jpcb.2c03557. Epub 2022 Aug 1. J Phys Chem B. 2022. PMID: 35913832 Free PMC article.
-
New World Arenavirus Biology.Annu Rev Virol. 2017 Sep 29;4(1):141-158. doi: 10.1146/annurev-virology-101416-042001. Epub 2017 Jun 23. Annu Rev Virol. 2017. PMID: 28645238 Free PMC article. Review.
-
Can SARS-CoV-2 Virus Use Multiple Receptors to Enter Host Cells?Int J Mol Sci. 2021 Jan 20;22(3):992. doi: 10.3390/ijms22030992. Int J Mol Sci. 2021. PMID: 33498183 Free PMC article. Review.
References
-
- Buchmeier MJ, de la Torre JC, Peters CJ. 2007. Arenaviridae: the viruses and their replication, p 1791–1828 In Knipe DM, Howley PM, Griffin DE, Lamb RA, Martin MA, Roizman B, Straus SE. (ed), Fields virology, 5th ed. Lippincott Williams & Wilkins, Philadelphia, PA
Publication types
MeSH terms
Substances
Grants and funding
LinkOut - more resources
Full Text Sources
Other Literature Sources
Medical
Molecular Biology Databases
Research Materials
Miscellaneous
