. 2014 Jul;88(13):7628-44.
doi: 10.1128/JVI.03812-13. Epub 2014 Apr 23.

Statistical linkage analysis of substitutions in patient-derived sequences of genotype 1a hepatitis C virus nonstructural protein 3 exposes targets for immunogen design

Affiliations

Statistical linkage analysis of substitutions in patient-derived sequences of genotype 1a hepatitis C virus nonstructural protein 3 exposes targets for immunogen design

Ahmed A Quadeer et al. J Virol. 2014 Jul.

Abstract

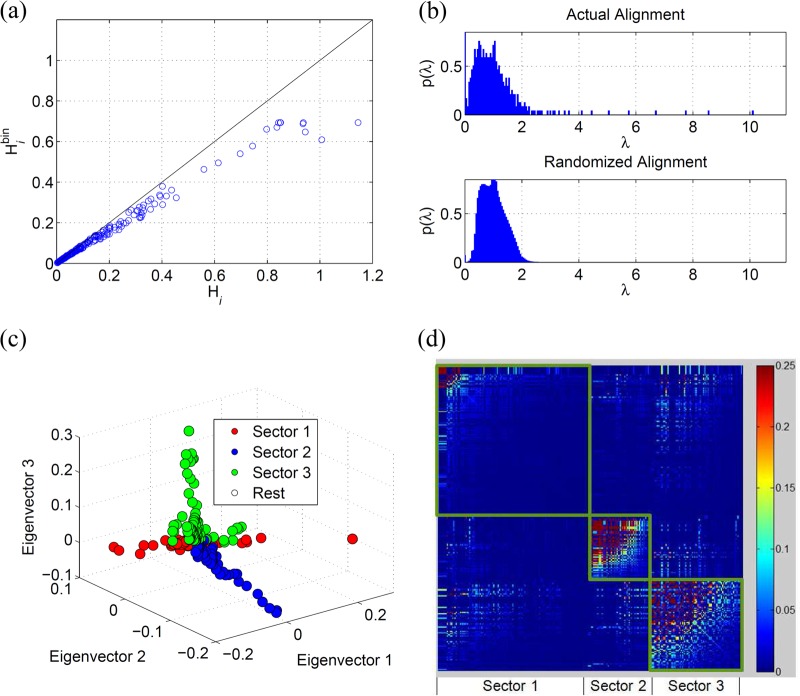
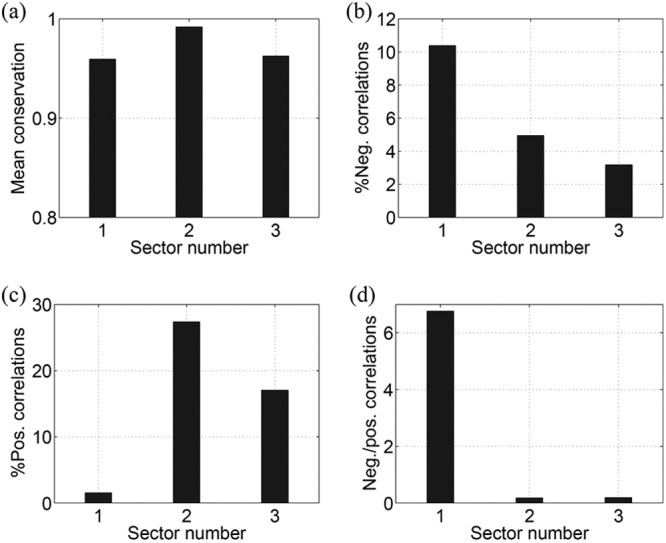
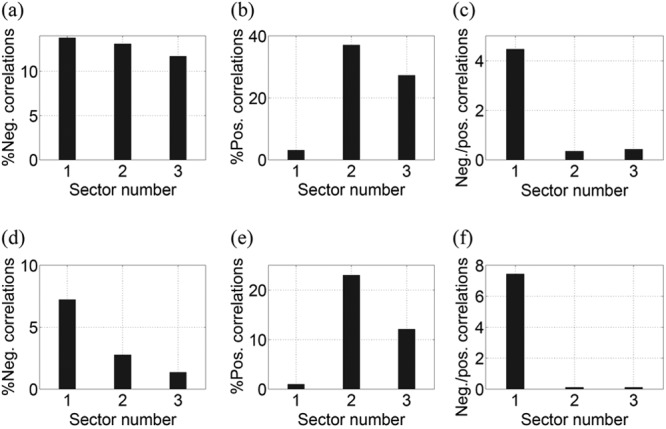
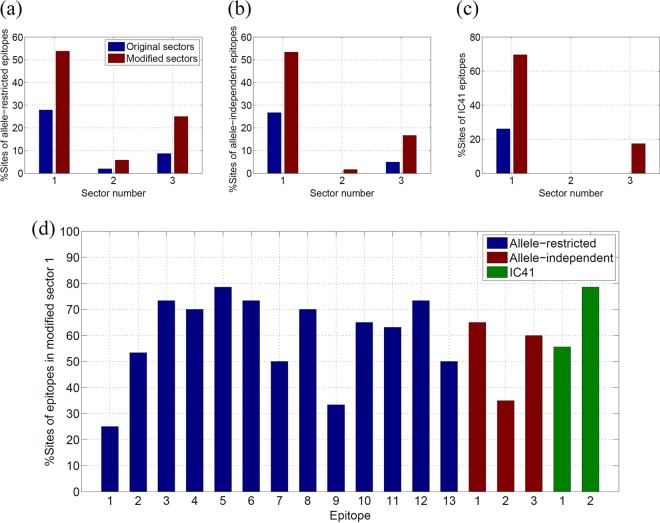
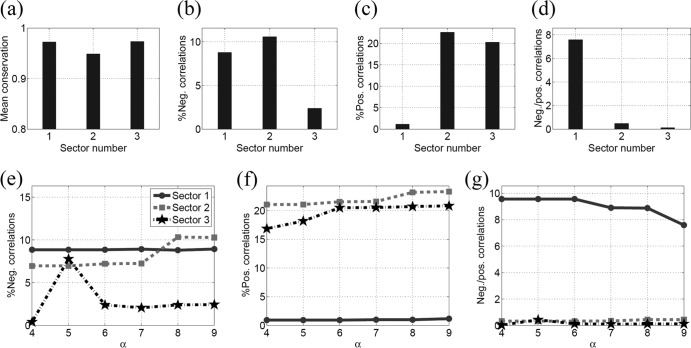
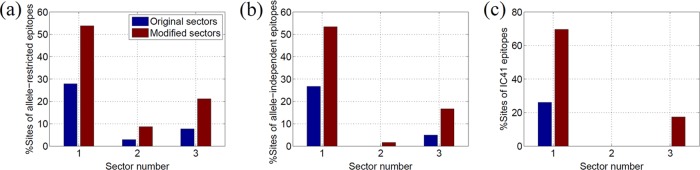
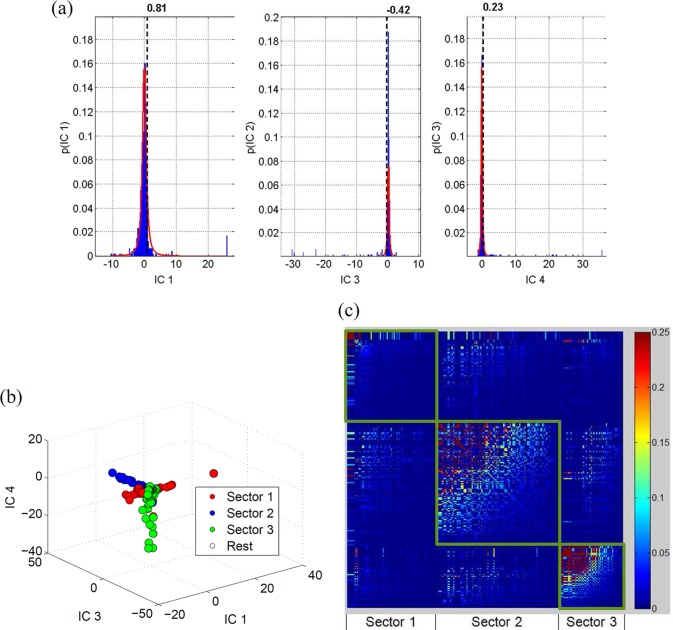
Chronic hepatitis C virus (HCV) infection is one of the leading causes of liver failure and liver cancer, affecting around 3% of the world's population. The extreme sequence variability of the virus resulting from error-prone replication has thwarted the discovery of a universal prophylactic vaccine. It is known that vigorous and multispecific cellular immune responses, involving both helper CD4(+) and cytotoxic CD8(+) T cells, are associated with the spontaneous clearance of acute HCV infection. Escape mutations in viral epitopes can, however, abrogate protective T-cell responses, leading to viral persistence and associated pathologies. Despite the propensity of the virus to mutate, there might still exist substitutions that incur a fitness cost. In this paper, we identify groups of coevolving residues within HCV nonstructural protein 3 (NS3) by analyzing diverse sequences of this protein using ideas from random matrix theory and associated methods. Our analyses indicate that one of these groups comprises a large percentage of residues for which HCV appears to resist multiple simultaneous substitutions. Targeting multiple residues in this group through vaccine-induced immune responses should either lead to viral recognition or elicit escape substitutions that compromise viral fitness. Our predictions are supported by published clinical data, which suggested that immune genotypes associated with spontaneous clearance of HCV preferentially recognized and targeted this vulnerable group of residues. Moreover, mapping the sites of this group onto the available protein structure provided insight into its functional significance. An epitope-based immunogen is proposed as an alternative to the NS3 epitopes in the peptide-based vaccine IC41.

Importance: Despite much experimental work on HCV, a thorough statistical study of the HCV sequences for the purpose of immunogen design was missing in the literature. Such a study is vital to identify epistatic couplings among residues that can provide useful insights for designing a potent vaccine. In this work, ideas from random matrix theory were applied to characterize the statistics of substitutions within the diverse publicly available sequences of the genotype 1a HCV NS3 protein, leading to a group of sites for which HCV appears to resist simultaneous substitutions possibly due to deleterious effect on viral fitness. Our analysis leads to completely novel immunogen designs for HCV. In addition, the NS3 epitopes used in the recently proposed peptide-based vaccine IC41 were analyzed in the context of our framework. Our analysis predicts that alternative NS3 epitopes may be worth exploring as they might be more efficacious.


Figures

FIG 1
FIG 1
(a) Comparison of the entropy for each site of NS3 in the binary representation (equation 9) with the entropy computed from the complete representation (equation 10). (b) Eigenvalue distribution of NS3 computed from the correlation matrix resulting from the actual alignment (upper panel) and randomized alignment (lower panel). (c) 3-D scatter plot of the loadings of the eigenvectors 1, 2, and 3 showing the three distinct sectors. (d) Heat map of the cleaned correlation matrix with rows and columns ordered according to the sites in the three sectors of NS3. The rows and the columns of the correlation matrix were arranged according to the sectors so that the sectors appear as squares in the heat map. The sites within each sector were further arranged in descending order with respect to their correlation values in the cleaned correlation matrix.
FIG 2
FIG 2
Statistics of the mutational correlations in NS3 sectors. (a) The mean of single-site conservation. (b) The percentage of negative correlations. (c) The percentage of positive correlations. (d) The ratio of negative to positive correlations.
FIG 3
FIG 3
Statistics of the three sectors of NS3 when the positive and negative thresholds (δ+ and δ) in equation 7 are decreased by 50% (a to c) and increased by 50% (d to f). This figure demonstrates the robustness of the correlations in the sectors to the variations in the thresholds given in equation 7.
FIG 4
FIG 4
Structural significance of the sites in sector 1 of NS3. (a) Sites of sector 1 in the allosteric pocket at the interface of the protease (gray) and the helicase (blue) domains of NS3 protein (PDB code 4B6E) are shown as red spheres. Only the C-α atoms of all the sites are shown for clean presentation. All the remaining sites in sector 1 are also shown in the figure as yellow spheres. (b) C-α atoms of the sites at the interface between NS3 helicase chains A (pale green) and B (gray) in the dimer structure (PDB code 2F55) are shown as dark green and blue spheres, respectively. The interface sites of chain A and chain B present in sector 1 are shown as red and yellow spheres, respectively. The main chain of all the interface sites is also shown as sticks. Site 526NS3 (1552H77) of chain A and site 590NS3 (1616H77) of chain B, which were part of sector 1, were of particular importance because they seemed to be interacting with each other, as the distance between these two sites was 5.5 Å (inset A) and the surfaces of these two sites appeared to be attached to each other (inset B).
FIG 5
FIG 5
(a) Percentage of sites in the NS3-specific allele-restricted protective epitopes present in the original sectors and the modified sectors obtained by incorporating the neighboring 100% conserved sites. This percentage was calculated as Nes/Ne × 100, where Nes is the number of sites in the epitopes that were present in the sector and Ne is the total number of sites in the epitopes. (b) Percentage of sites in the NS3-specific allele-independent protective epitopes present in the original sectors and the modified sectors. (c) Percentage of sites in the NS3-specific IC41 epitopes present in the original sectors and the modified sectors. (d) Percentage of sites of allele-restricted protective epitopes, allele-independent protective epitopes, and IC41 epitopes in modified sector 1.
FIG 6
FIG 6
Flowchart of the second immunogen design that minimizes the fitness of the escaping viral strains. The path followed by the 10 selected combinations of epitopes that minimize the potential escape paths in the case of NS3 is shown by the dotted line.
FIG A1
FIG A1
Consistency in the statistics of the three sectors of NS3 when the cleaned correlation matrix was constructed using selective large eigenvalues (4 < α < 9). (a) The percentage of negative correlations. (b) The percentage of positive correlations. (c) The ratio of negative to positive correlations. (d to f) Statistics of the sectors as a function of the number of eigenvalues selected to construct the cleaned correlation matrix for NS3 using the RMT-based modified eigenvalue clipping method (43). (g to i) RMT-based estimation of true eigenvalues from sample eigenvalues (44).
FIG A2
FIG A2
(a) 3-D scatter plot of the loadings of the independent components 1, 2, and 3 showing the three distinct sectors of NS3 constructed using the ICA method. (b) Heat map of the cleaned correlation matrix with rows and columns ordered according to the sites in the three sectors of NS3 constructed using the ICA method.
FIG A3
FIG A3
(a to d) Statistics of the three sectors of NS3 constructed using the ICA method. (a) The mean of single-site conservation. (b) The percentage of negative correlations. (c) The percentage of positive correlations. (d) The ratio of negative to positive correlations. (e to g) Consistency in the statistics of the three sectors of NS3 (constructed using the ICA method) when the cleaned correlation matrix was constructed using selective large eigenvalues (4 < α < 9). (e) The percentage of negative correlations. (f) The percentage of positive correlations. (g) The ratio of negative to positive correlations.
FIG A4
FIG A4
Analysis of the three sectors of NS3 constructed using the ICA method. (a) Percentage of sites in the NS3-specific allele-restricted protective epitopes present in the original sectors and the modified sectors obtained by incorporating the neighboring 100% conserved sites. (b) Percentage of sites in the NS3-specific allele-independent protective epitopes present in the original sectors and the modified sectors. (c) Percentage of sites in the NS3-specific IC41 epitopes present in the original sectors and the modified sectors.
FIG A5
FIG A5
(a) The distribution of independent components 1, 3, and 4 (in blue), along with the fitted t location-scale distribution (in red). The threshold values used to form the sectors are also shown by the dotted black line. (b) 3-D scatter plot of the loadings of the independent components 1, 3, and 4 showing the three distinct sectors of NS3 constructed using ICA and the distribution fitting method. (c) Heat map of the cleaned correlation matrix with rows and columns ordered according to the sites in the three sectors of NS3 constructed using ICA and the distribution fitting method.
FIG A6
FIG A6
(a to d) Statistics of the three sectors of NS3 constructed using ICA and the distribution fitting method. (a) The mean of single-site conservation. (b) The percentage of negative correlations. (c) The percentage of positive correlations. (d) The ratio of negative to positive correlations. (e to g) Consistency in the statistics of the three sectors of NS3 (constructed using the ICA method) when the cleaned correlation matrix was constructed using selective large eigenvalues (4 < α < 9). (e) The percentage of negative correlations. (f) The percentage of positive correlations. (g) The ratio of negative to positive correlations.
FIG A7
FIG A7
Analysis of the three sectors of NS3 constructed using ICA and the distribution fitting method. (a) Percentage of sites in the NS3-specific allele-restricted protective epitopes present in the original sectors and the modified sectors obtained by incorporating the neighboring 100% conserved sites. (b) Percentage of sites in the NS3-specific allele-independent protective epitopes present in the original sectors and the modified sectors. (c) Percentage of sites in the NS3-specific IC41 epitopes present in the original sectors and the modified sectors.

Similar articles

Cited by

References

    1. World Health Organization. 2013. Factsheet, hepatitis C. World Health Organization, Geneva, Switzerland
    1. Lauer G, Walker B. 2001. Hepatitis C virus infection. N. Engl. J. Med. 345:41–52. 10.1056/NEJM200107053450107 - DOI - PubMed
    1. Afdhal NH. 2004. The natural history of hepatitis C. Semin. Liver Dis. 24:3–8. 10.1055/s-2004-832922 - DOI - PubMed
    1. National Institutes of Health. 2002. National Institutes of Health Consensus Development Conference statement: management of hepatitis C: 2002–June 10–12, 2002. Hepatology 36(Suppl 1):S3–S20. 10.1053/jhep.2002.37117 - DOI - PubMed
    1. Grieve R, Roberts J, Wright M, Sweeting M, DeAngelis D, Rosenberg W, Bassendine M, Main J, Thomas H. 2006. Cost effectiveness of interferon alpha or peginterferon alpha with ribavirin for histologically mild chronic hepatitis C. Gut 55:1332–1338. 10.1136/gut.2005.064774 - DOI - PMC - PubMed

Publication types

MeSH terms

Substances