. 2014 Jul;22(4):870-8.
doi: 10.1109/TNSRE.2014.2307256. Epub 2014 Feb 27.

Estimation of human ankle impedance during the stance phase of walking

Estimation of human ankle impedance during the stance phase of walking

Elliott J Rouse et al. IEEE Trans Neural Syst Rehabil Eng. 2014 Jul.

Abstract

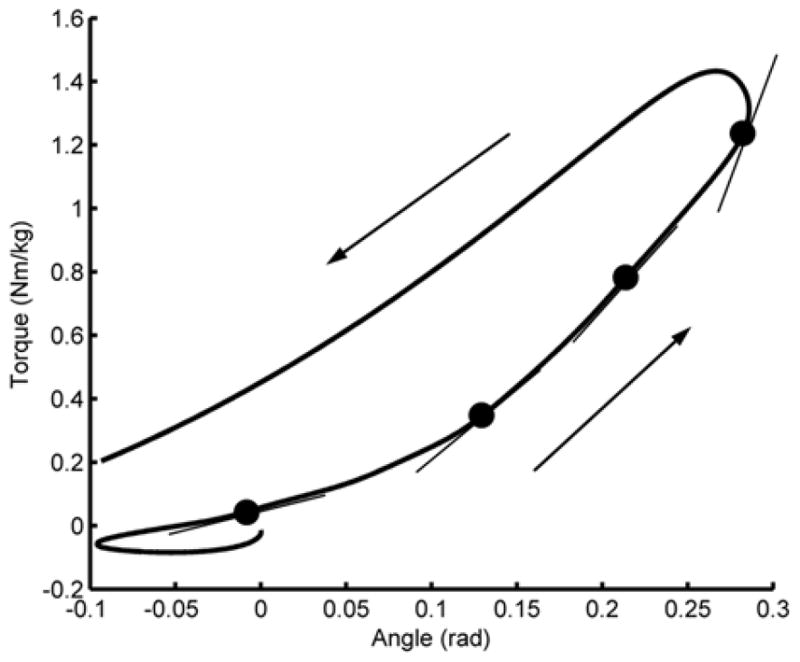
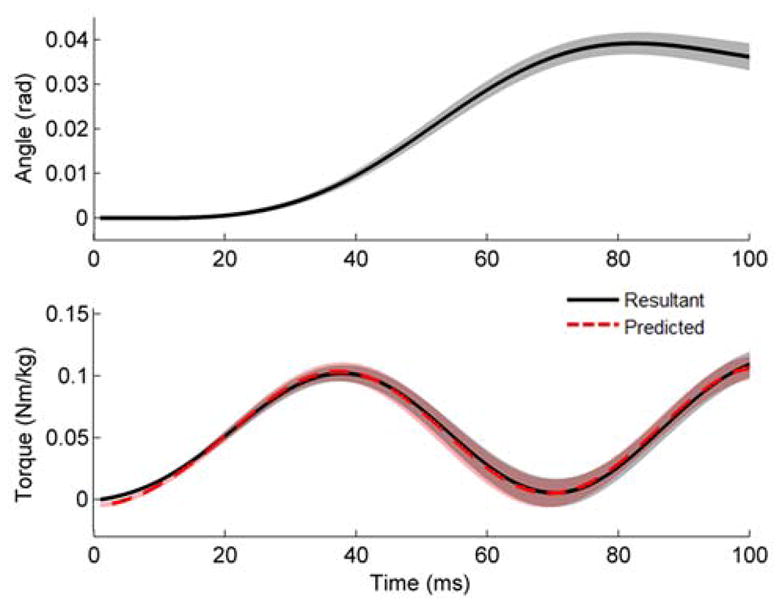
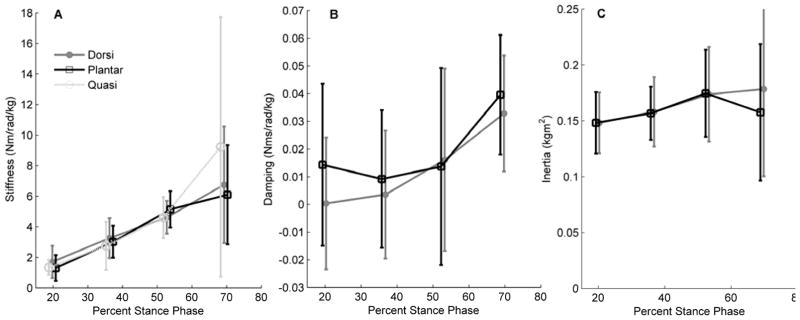
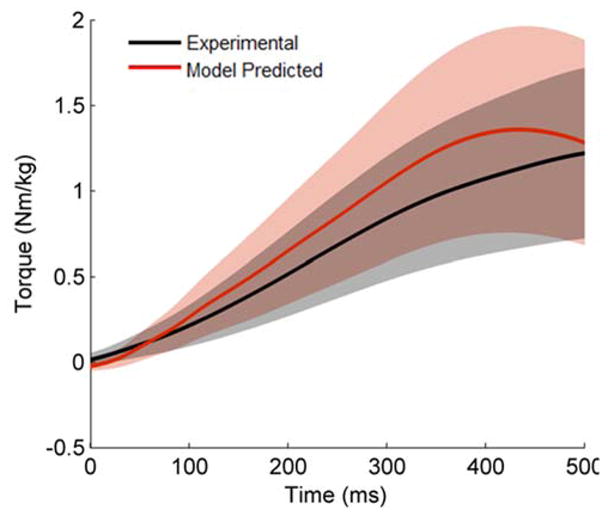
Human joint impedance is the dynamic relationship between the differential change in the position of a perturbed joint and the corresponding response torque; it is a fundamental property that governs how humans interact with their environments. It is critical to characterize ankle impedance during the stance phase of walking to elucidate how ankle impedance is regulated during locomotion, as well as provide the foundation for future development of natural, biomimetic powered prostheses and their control systems. In this study, ankle impedance was estimated using a model consisting of stiffness, damping and inertia. Ankle torque was well described by the model, accounting for 98 ±1.2% of the variance. When averaged across subjects, the stiffness component of impedance was found to increase linearly from 1.5 to 6.5 Nm/rad/kg between 20% and 70% of stance phase. The damping component was found to be statistically greater than zero only for the estimate at 70% of stance phase, with a value of 0.03 Nms/rad/kg. The slope of the ankle's torque-angle curve-known as the quasi-stiffness-was not statistically different from the ankle stiffness values, and showed remarkable similarity. Finally, using the estimated impedance, the specifications for a biomimetic powered ankle prosthesis were introduced that would accurately emulate human ankle impedance during locomotion.


Figures

Fig. 1
Fig. 1
Left: Schematic of Perturberator Robot shown with relevant features highlighted, reprinted from [30]. Right: Perturberator Robot shown recessed into walkway. Total walkway length was approximately 5.25 meters.
Fig. 2
Fig. 2
Diagram showing ground reaction forces acting on the foot (solid). The resultant (dashed) ankle torque, Ta, is computed by multiplying the ground reaction force components by their respective perpendicular distances.
Fig. 3
Fig. 3
Mean values (bold) and standard deviations (translucent) for the non-perturbed trials (black line) and the first timing point with a dorsiflexion perturbation (red line) shown for a representative subject. Column A shows data from stance phase with perturbation onset denoted by the vertical line. Column B shows data during the analysis window. The impedance is estimated by the difference between the perturbed and non-perturbed data.
Fig. 4
Fig. 4
Average torque-angle relationship for a representative subject. The timing points are denoted by dots and the quasi-stiffness was calculated as the slope of the relationship at each timing point (thin black lines).
Fig. 5
Fig. 5
The resultant ankle angle (top) and resultant torque (bottom) plotted as a function of time for a representative subject and experimental conditions. The time window begins with the onset of the perturbation. The means are shown in bold with standard deviation in translucent. Note that these standard deviations reflect the variation in the mean of the bootstrap results, not the original data. The subject’s resultant ankle angle and torque profiles are shown in black and the model predicted torque is shown in dashed red.
Fig. 6
Fig. 6
Inter-subject average stiffness (A), damping (B) and inertia (C) estimates as a function of percentage of stance phase. Error bars denote the standard deviation across subjects and are offset for clarity. Marker style denotes perturbation type, with ‘Quasi’ denoting values obtained without a perturbation (i.e. quasi-stiffness). Stiffness estimates increased linearly with stance phase and quasi-stiffness values and stiffness estimates were not different. Damping estimates increased, with only the estimates at 70% differing significantly from zero and inertia was not different across timing points or perturbation directions.
Fig. 7
Fig. 7
Model predicted experimental torques shown of a representative subject during the foot flat region of stance phase. The model predicted torques were generated using the impedance control equation and the quadratic spring relationship. Standard deviations are shown in translucent.

References

    1. Winter DA. Energy generation and absorption at the ankle and knee during fast, natural, and slow cadences. Clin Orthop. 1983;(175):147. - PubMed
    1. Neptune R, Zajac F, Kautz S. Muscle force redistributes segmental power for body progression during walking. Gait Posture. 2004;19(2):194–205. - PubMed
    1. Mann RA, Hagy J. Biomechanics of walking, running, and sprinting. The American journal of sports medicine. 1980;8(5):345–350. - PubMed
    1. Kadaba MP, Ramakrishnan H, Wootten M. Measurement of lower extremity kinematics during level walking. J Orthop Res. 1990;8(3):383–392. - PubMed
    1. Eng JJ, Winter DA. Kinetic analysis of the lower limbs during walking: what information can be gained from a three-dimensional model? J Biomech. 1995;28(6):753–758. - PubMed

Publication types