

Processed foods: contributions to nutrition
- PMID: 24760975
- PMCID: PMC6410904
- DOI: 10.3945/ajcn.114.089284
Processed foods: contributions to nutrition
Abstract
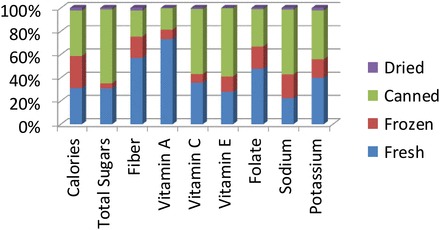
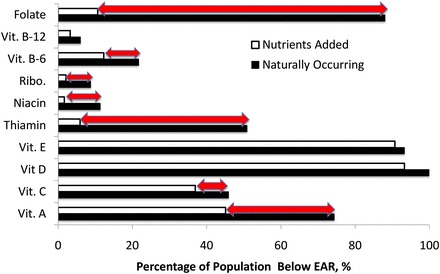
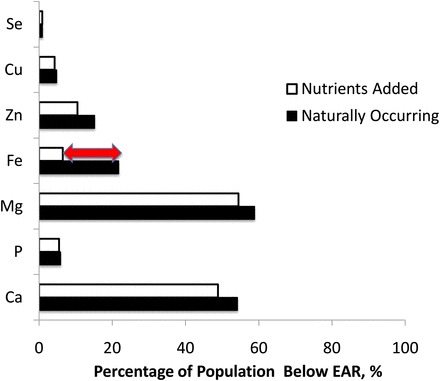
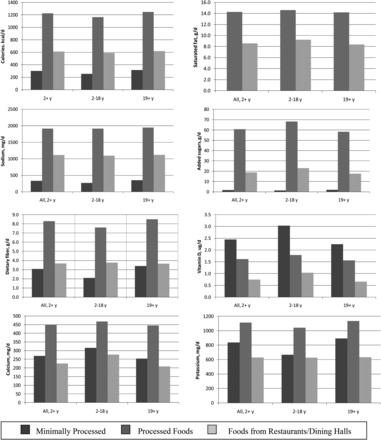
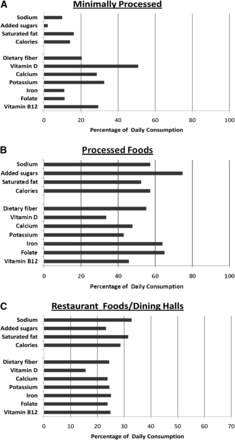
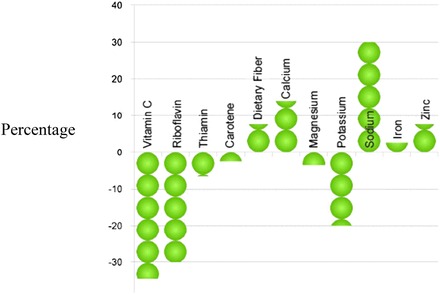
Both fresh and processed foods make up vital parts of the food supply. Processed food contributes to both food security (ensuring that sufficient food is available) and nutrition security (ensuring that food quality meets human nutrient needs). This ASN scientific statement focuses on one aspect of processed foods: their nutritional impacts. Specifically, this scientific statement 1) provides an introduction to how processed foods contribute to the health of populations, 2) analyzes the contribution of processed foods to "nutrients to encourage" and "constituents to limit" in the American diet as recommended by the Dietary Guidelines for Americans, 3) identifies the responsibilities of various stakeholders in improving the American diet, and 4) reviews emerging technologies and the research needed for a better understanding of the role of processed foods in a healthy diet. Analyses of the NHANES 2003-2008 show that processed foods provide both nutrients to encourage and constituents to limit as specified in the 2010 Dietary Guidelines for Americans. Of the nutrients to encourage, processed foods contributed 55% of dietary fiber, 48% of calcium, 43% of potassium, 34% of vitamin D, 64% of iron, 65% of folate, and 46% of vitamin B-12. Of the constituents to limit, processed foods contributed 57% of energy, 52% of saturated fat, 75% of added sugars, and 57% of sodium. Diets are more likely to meet food guidance recommendations if nutrient-dense foods, either processed or not, are selected. Nutrition and food science professionals, the food industry, and other stakeholders can help to improve the diets of Americans by providing a nutritious food supply that is safe, enjoyable, affordable, and sustainable by communicating effectively and accurately with each other and by working together to improve the overall knowledge of consumers.
© 2014 American Society for Nutrition.
Figures
References
-
- Floros JD Newsome R Fisher W Barbosa-Canovas GV Chen H Dunne P German JB Hall RL Heldman DR Karwe MV, et al. Feeding the world today and tomorrow: the importance of food science and technology. An IFT Scientific Review. Compr Rev Food Sci Food Saf 2010;9:572–99. - PubMed
-
- Conway C.. One billion hungry: can we feed the world? Ithaca, NY: Cornell University Press, 2012.
-
- Von Grebmer K Ringler C Rosegrant MW Ologinbiyi T Wiesman D Fritschel H Badiane O Torero M Yohannes Y Thompson J, et al. 2012 Global Hunter Index. The challenge of hunger: ensuring sustainablefood security under land, water and energy stress. Washington, DC: International Food Policy Research Institute, 2012.
-
- Simmons J.. Making safe, affordable and abundant food a global reality. Presented at: 19th World Meat Congress, June 4–6, 2010; Paris, France. Available from: http://www.meat-ims.org/wp-content/uploads/2012/06/Simmons-World-Meat-Co... (cited 23 August 2013).
-
- Polon RH Stoody EE.. Dietary guidelines for Americans, 2010: national nutrition policy In: Rippe JM. ed. Lifestyle medicine. 2nd ed.Boca Raton, FL: CRC Press, 2013:131–47.
MeSH terms
LinkOut - more resources
Full Text Sources
Other Literature Sources
Medical
