. 2014 Jun 15;306(12):C1200-13.
doi: 10.1152/ajpcell.00329.2013. Epub 2014 Apr 23.

Cav1.2 and Cav1.3 L-type calcium channels operate in a similar voltage range but show different coupling to Ca(2+)-dependent conductances in hippocampal neurons

Affiliations

Cav1.2 and Cav1.3 L-type calcium channels operate in a similar voltage range but show different coupling to Ca(2+)-dependent conductances in hippocampal neurons

Julia Hasreiter et al. Am J Physiol Cell Physiol. .

Abstract

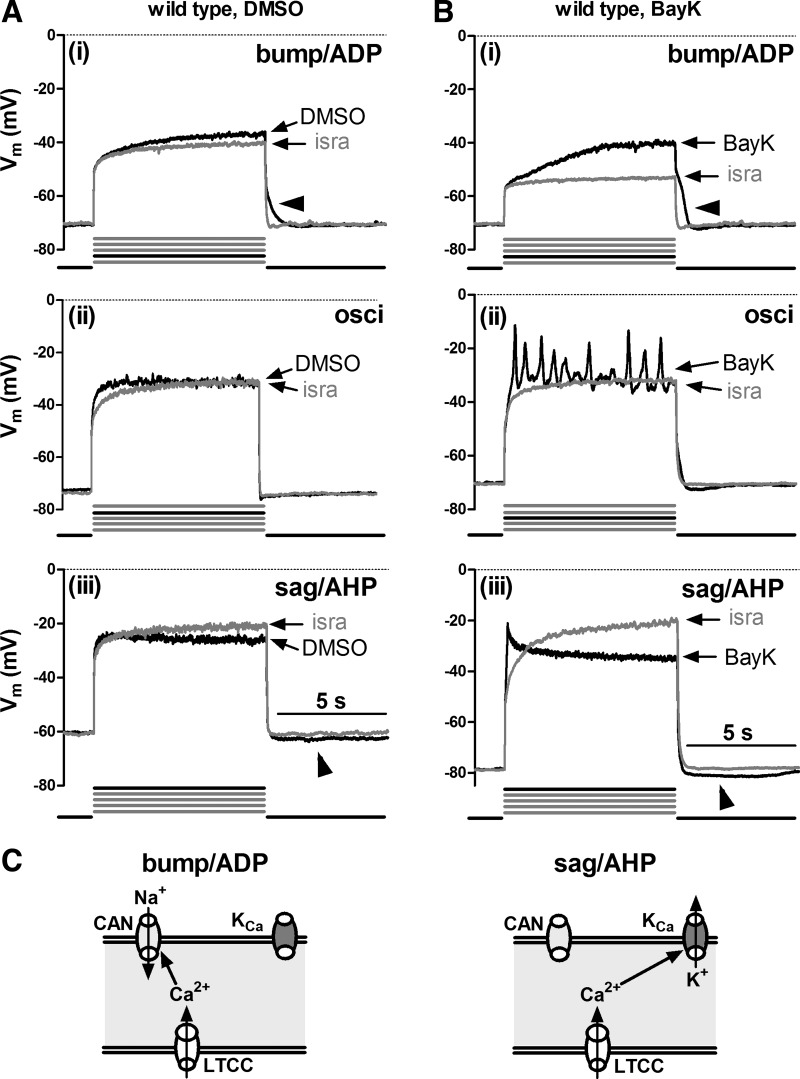
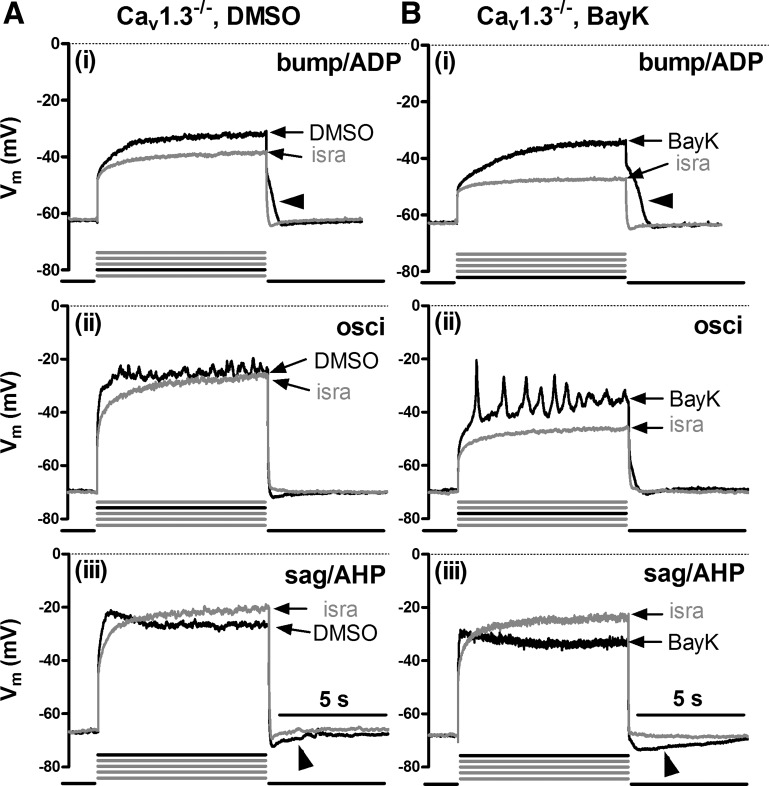
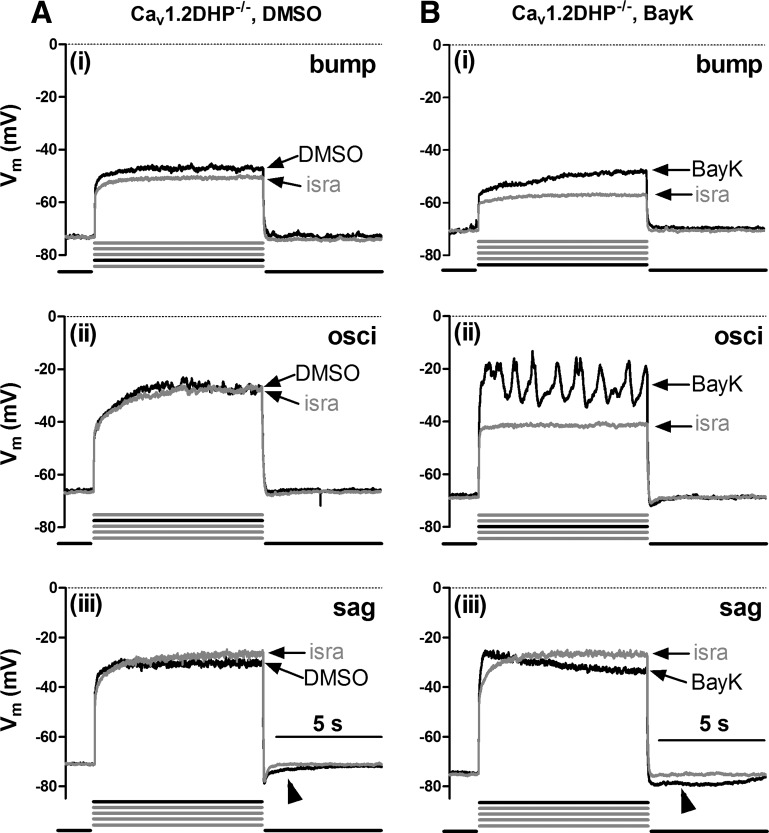
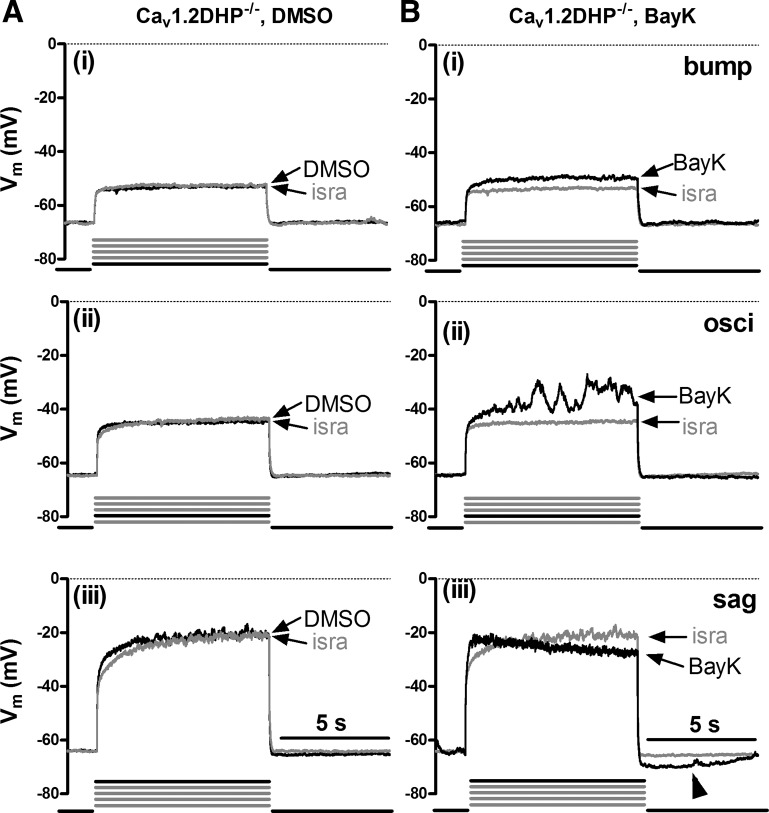
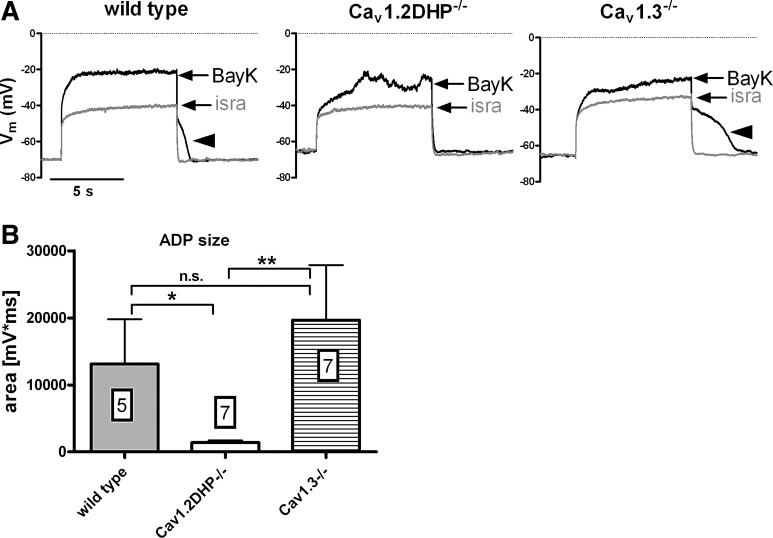
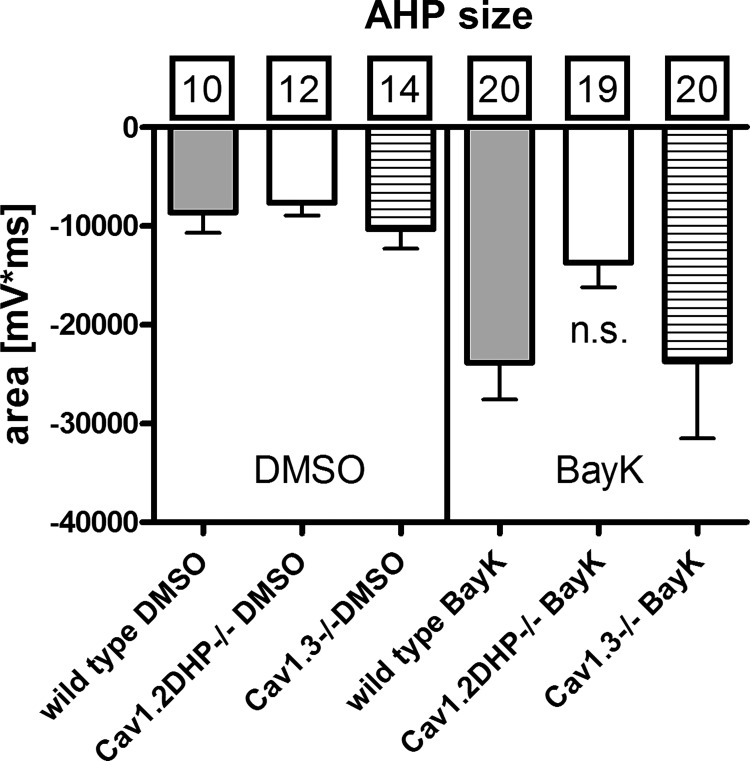
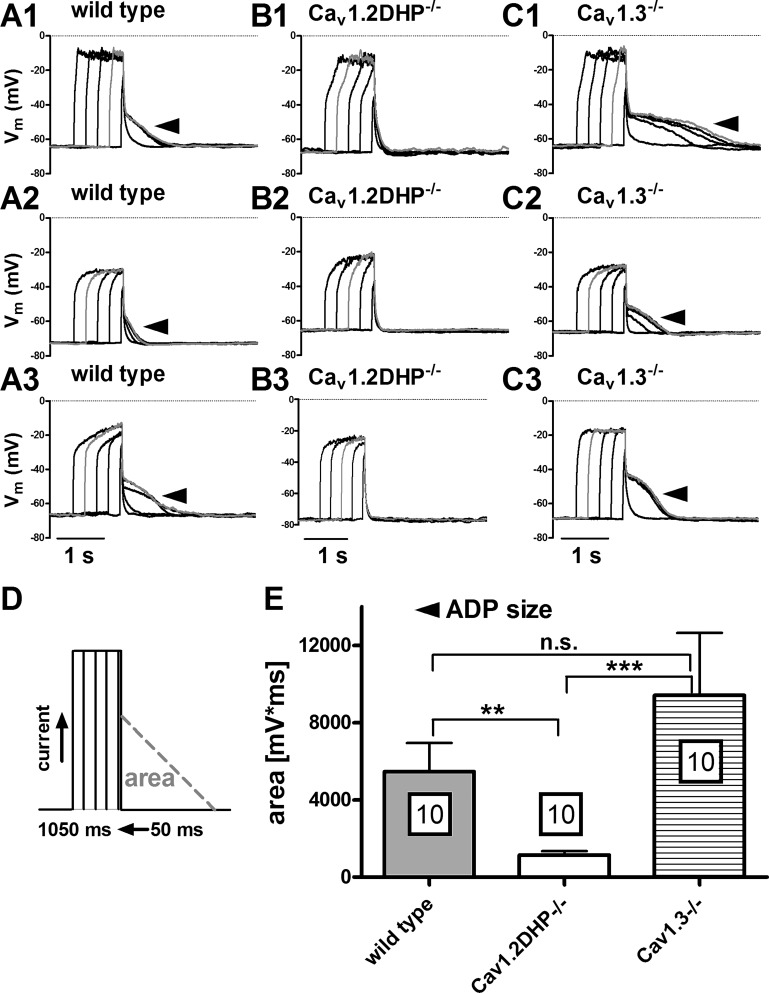
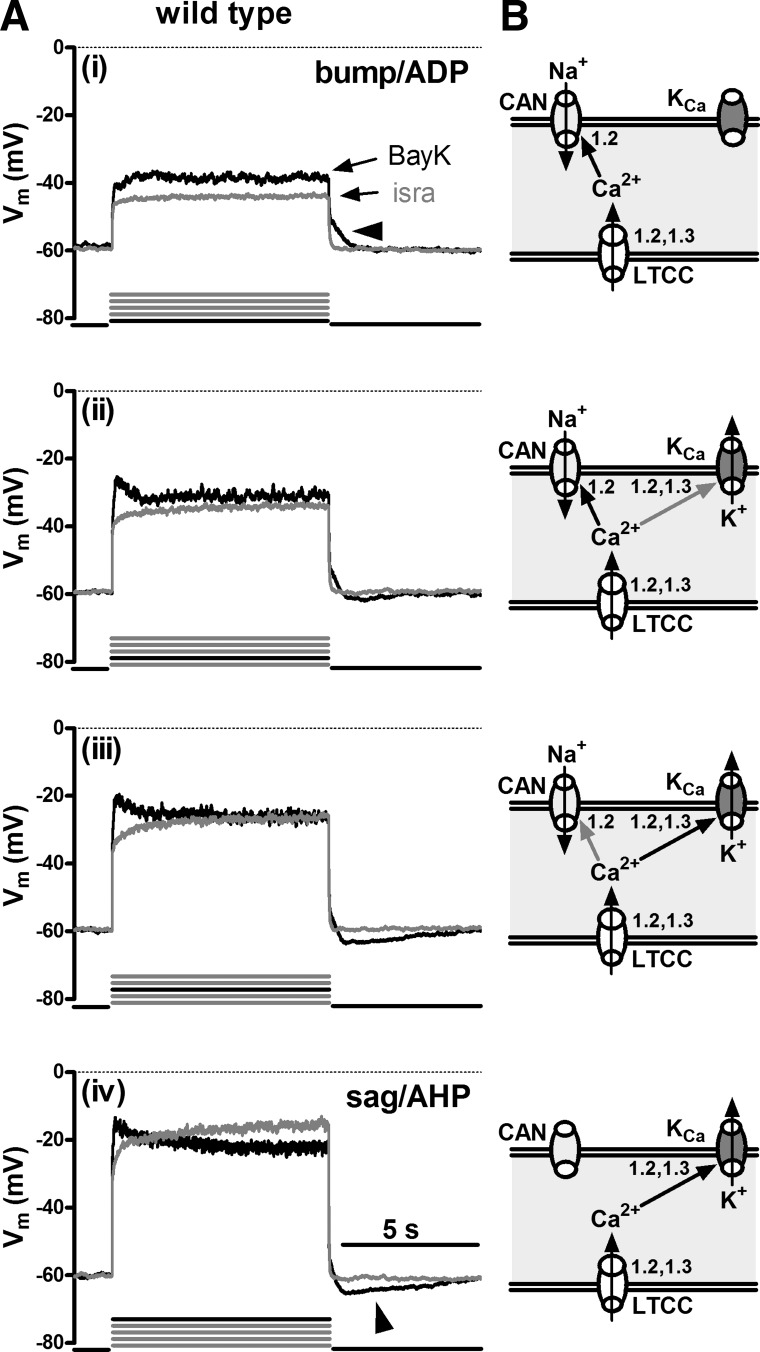
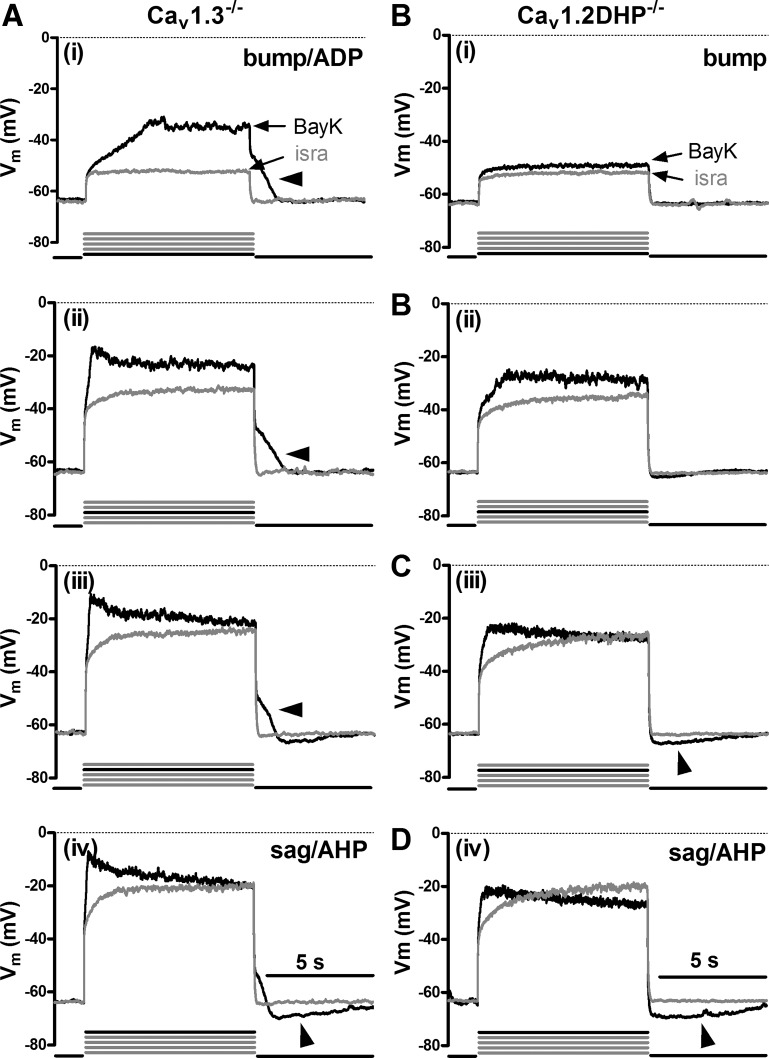
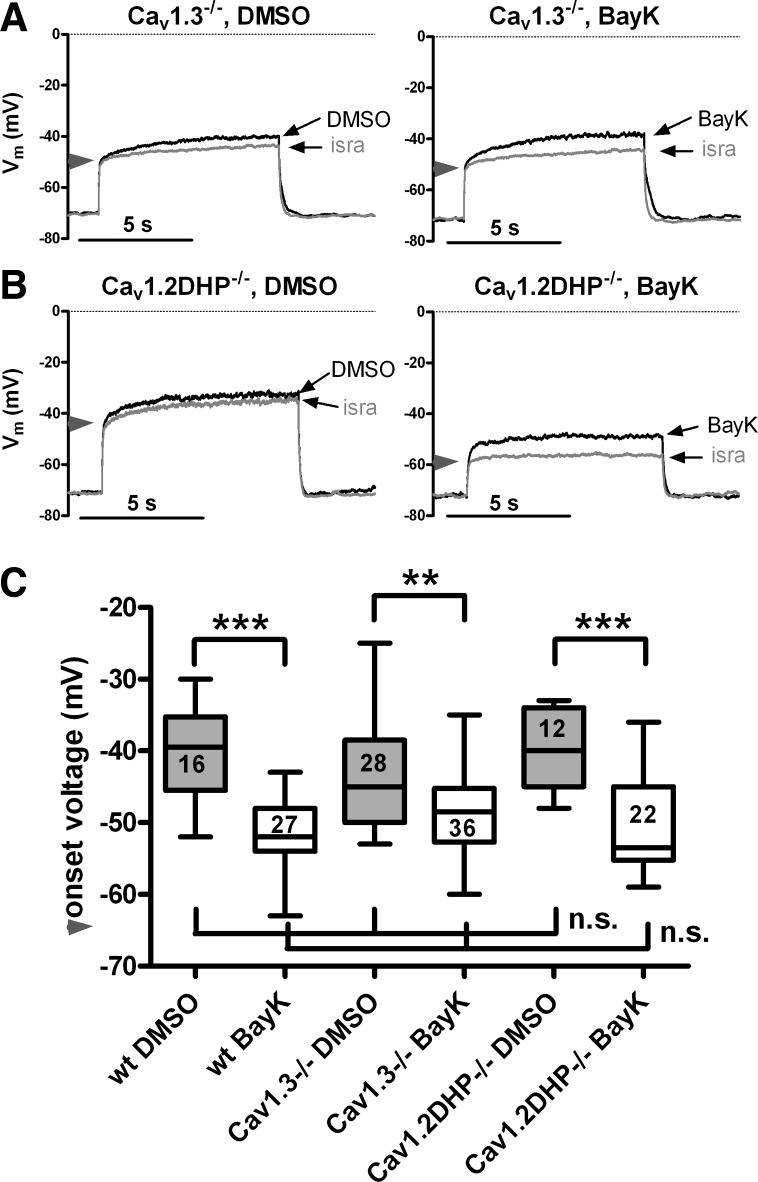
In the central nervous system, L-type voltage-gated calcium channels (LTCCs) come in two isoforms, namely Cav1.2 and Cav1.3 channels. It has been shown previously that these channels differ in biophysical properties, in subcellular localization, and in the coupling to the gene transcription machinery. In previous work on rat hippocampal neurons we have identified an excitatory cation conductance and an inhibitory potassium conductance as important LTCC coupling partners. Notably, a stimulus-dependent interplay of LTCC-mediated Ca(2+) influx and activation of these Ca(2+)-dependent conductances was found to give rise to characteristic voltage responses. However, the contribution of Cav1.2 and Cav1.3 to these voltage responses remained unknown. Hence, the relative contribution of the LTCC isoforms therein was the focus of the current study on hippocampal neurons derived from genetically modified mice, which either lack a LTCC isoform (Cav1.3 knockout mice) or express a dihydropyridine-insensitive LTCC isoform (Cav1.2DHP(-)-knockin mice). We identified common and alternate ion channel couplings of Cav1.2 and Cav1.3 channels. Whereas hyperpolarizing Ca(2+)-dependent conductances were coupled to both Cav1.2 and Cav1.3 channels, an afterdepolarizing potential was only induced by the activity of Cav1.2 channels. Unexpectedly, the activity of Cav1.2 channels was found at relatively hyperpolarized membrane voltages. Our data add important information about the differences between Cav1.2 and Cav1.3 channels that furthers our understanding of the physiological and pathophysiological neuronal roles of these calcium channels. Moreover, our findings suggest that Cav1.3 knockout mice together with Cav1.2DHP(-)-knockin mice provide valuable models for future investigation of hippocampal LTCC-dependent afterdepolarizations.

Keywords: dihydropyridine; gene deletion; knockout; voltage-gated calcium channel.


Figures

Fig. 1.
Fig. 1.
L-type voltage-gated calcium channel (LTCC)-mediated voltage responses in mouse hippocampal neurons. Voltage traces evoked by injection of current in the presence of isradipine (isra; grey traces) are overlaid with those recorded in the same wild-type neuron when only solvent (DMSO; A, black traces) or when Bay K8644 (BayK; B, black traces) was present in the superfusate (B). Overlays in A and B are from different neurons and illustrate the main types of active responses that could be readily classified according to their coarse appearance, namely bumps (i) and hyperpolarizing sags (sag; iii). Bumps and hyperpolarizing sags were followed after termination of the current injection by afterdepolarizations (ADP) and afterhyperpolarizations (AHPs), respectively. ii: voltage responses with associated oscillatory activity (osci). Horizontal arrowheads mark ADPs and oblique arrowheads mark AHPs. Below each pairs of traces, the number of the pulse (black line) out of 5 incremental current injections (grey lines) that typically evoked the depicted response mode is indicated. C: schematic illustrations of the conductances that may underlie the 2 response modes: bump/ADPs are suggested to be due to Ca2+ influx via LTCCs and activation of Ca2+-dependent nonselective cation channels (CAN). Sag/AHPs are suggested to be due to Ca2+ influx via LTCCs and activation of Ca2+-dependent potassium channels (KCa). Vm, membrane potential.
Fig. 2.
Fig. 2.
LTCC-mediated voltage responses in Cav1.3−/− neurons. Overlays of voltage traces as in Fig. 1 (see there for a description of the labeling) but from different Cav1.3−/− neurons recorded in the presence of isra (grey traces) and either DMSO (A, black traces) or BayK (B, black traces). Arrowheads indicate afterpotentials.
Fig. 3.
Fig. 3.
LTCC-mediated voltage responses in dihydropyridine-insensitive LTCC isoform variant (Cav1.2DHP−/−) neurons. Overlays of voltage traces as in Fig. 1 (see there for a description of the labeling) but from different Cav1.2DHP−/− neurons recorded in the presence of isra (grey traces) and either DMSO (A, black traces) or BayK (B, black traces). Arrowheads indicate afterpotentials.
Fig. 4.
Fig. 4.
Cav1.3-mediated voltage responses. The induction of active voltage response by BayK in Cav1.2DHP−/− neurons is demonstrated by a comparison of traces recorded in 3 neurons in the presence of solvent (DMSO) only (A) with traces recorded from the same neurons after addition of BayK (B). All responses are shown in overlays with the corresponding trace obtained when isradipine was present. Ai and Bi, Aii and Bii, Aiii and Biii are from the same neuron. Pronounced differences from the isra traces [bump (i), osci (ii), and sag (iii) responses] were only induced when BayK was present, implicating that they were mediated by Cav1.3 channels.
Fig. 5.
Fig. 5.
Size of ADPs in neurons of wild-type and LTCC-gene modified mice. A: overlays of traces recorded in the presence of BayK and isradipine exemplify pronounced bump responses in neurons of wild-type (left), Cav1.2DHP−/− (middle), and Cav1.3−/− mice (right) that were selected for evaluation of the ADP size. Arrowheads indicate distinct depolarizing afterpotentials. B: average area of ADPs (mV·ms) recorded in the presence of BayK in response to 8 s-long current injections is displayed for neurons from the 3 mouse strains as indicated. Boxed figures indicate the number of experiments. Statistical analysis revealed a significant difference between wild-type and Cav1.2DHP−/− data (*P < 0.05), between Cav1.2DHP−/− and Cav1.3−/− data (**P < 0.01), but not between wild-type and Cav1.3−/− data (n.s., not significant).
Fig. 6.
Fig. 6.
Size of AHPs in neurons of wild-type and LTCC-gene modified mice. The average area of AHPs (mV·ms) recorded in the presence of DMSO (left) and BayK (right) is displayed for neurons from the 3 mouse strains as indicated. Boxed figures indicate the number of experiments. Statistical analysis did not reveal any significant difference between AHP areas of the 3 mice strains in both DMSO and BayK (n.s., not significant).
Fig. 7.
Fig. 7.
ADPs induced by brief depolarizing current injections require Cav1.2 channels. The traces in AC depict 3 examples each of voltage responses evoked by a series of brief current injections (duration 50 to 1,050 ms, as indicated in D) that are followed by ADPs in wild-type neurons (A1A3) and neurons derived from Cav1.3−/− neurons (C1C3) but are missing in neurons form Cav1.2DHP−/− mice (B1B3). The grey trace in each overlay depicts the response with the largest ADP in the series. In E the average area of the largest ADPs (mV·ms) is displayed for neurons from the 3 mouse strains as indicated. Boxed figures indicate the number of experiments. Statistical analysis revealed a significant difference between wild-type and Cav1.2DHP−/− data (**P < 0.01), between Cav1.2DHP−/− and Cav1.3−/− data (***P < 0.001), but not between wild-type and Cav1.3−/− data (n.s., not significant).
Fig. 8.
Fig. 8.
Transition between response modes in wild-type neurons. A: overlays of voltage responses recorded in the presence of BayK or isradipine by incremental current injections in a wild-type neuron (representative of 10 similar observations) illustrates the transition from bump/ADP (i) to sag/AHP (iv) responses as the level of depolarization was increased (iiv). Four out of 5 incremental current injections that were sequentially applied in the presence of BayK (black traces) and isradipine (grey traces) are shown. The schema in B schematically illustrate the conductances that may underlie the response modes: transition is suggested to be due to a sequential activation of initially Ca2+ influx via LTCCs (Cav1.2 and Cav1.3) and activation of Ca2+-dependent nonselective cation channels (CAN, via Cav1.2-mediated Ca2+ influx only) and subsequently Ca2+ influx via LTCCs (Cav1.2 and Cav1.3) and activation of Ca2+-dependent potassium channels (KCa, via Ca2+ influx through Cav1.2 and Cav1.3 LTCCs). Grey arrows indicate weak activation, and black arrows indicate strong activation. “1.2” and “1.3” indicate the Ca2+ entry route via Cav1.2 and Cav1.3 channels, respectively.
Fig. 9.
Fig. 9.
Transition between response modes in Cav1.3−/− and in Cav1.2DHP−/− neurons. The overlays illustrate the transition from bump to sag responses in a Cav1.3−/− neuron (A) and in a Cav1.2DHP−/− neuron (B) in the same manner as described in Fig. 8 for wild-type neurons. Both illustrations are representative for 11 similar observations.
Fig. 10.
Fig. 10.
Cav1.2 and Cav1.3 channels operate in an overlapping voltage range. Overlay of traces recorded in the presence of isradipine with those recorded when either solvent (DMSO; left) or BayK (right) was present from Cav1.3−/− neurons (A) and Cav1.2DHP−/− neurons (B). Responses were evoked with moderate depolarizations that led to bump responses, as shown for wild-type neurons in Fig. 1, A and B. The horizontal arrowheads on the y-axes indicate the divergence of the 2 overlaid traces, which was taken as an indication of the onset of the LTCC-mediated response. C: box plot of onsets determined for neurons derived from the 3 mouse strains under conditions of unaltered (DMSO) and potentiated (BayK) LTCC channels. Boxed figures indicate the number of experiments. Statistical analysis revealed that there is a highly significant difference between onsets recorded in the presence of DMSO and BayK in neurons of all mice strains (**P < 0.01 and ***P < 0.001). However, no statistical difference was observed when onsets were compared between mice strains, and this was true for both control conditions (DMSO) and in the presence of BayK.

Similar articles

Cited by

References

    1. Amano H, Amano T, Matsubayashi H, Ishihara K, Serikawa T, Sasa M. Enhanced calcium influx in hippocampal CA3 neurons of spontaneously epileptic rats. Epilepsia 42: 345–350, 2001 - PubMed
    1. Anekonda TS, Quinn JF, Harris C, Frahler K, Wadsworth TL, Woltjer RL. L-type voltage-gated calcium channel blockade with isradipine as a therapeutic strategy for Alzheimer's disease. Neurobiol Dis 41: 62–70, 2011 - PMC - PubMed
    1. Barad M. Later developments: molecular keys to age-related memory impairment. Alzheimer Dis Assoc Disord 17: 168–176, 2003 - PubMed
    1. Bouhadfane M, Tazerart S, Moqrich A, Vinay L, Brocard F. Sodium-mediated plateau potentials in lumbar motoneurons of neonatal rats. J Neurosci 33: 15626–15641, 2013 - PMC - PubMed
    1. Cai X, Liang CW, Muralidharan S, Kao JP, Tang CM, Thompson SM. Unique roles of SK and Kv4.2 potassium channels in dendritic integration. Neuron 44: 351–364, 2004 - PubMed

Publication types

Substances

LinkOut - more resources