. 2014 Jul 1;307(1):C83-96.
doi: 10.1152/ajpcell.00380.2013. Epub 2014 Apr 23.

P2Y2 nucleotide receptor activation enhances the aggregation and self-organization of dispersed salivary epithelial cells

Affiliations

P2Y2 nucleotide receptor activation enhances the aggregation and self-organization of dispersed salivary epithelial cells

Farid G El-Sayed et al. Am J Physiol Cell Physiol. .

Abstract

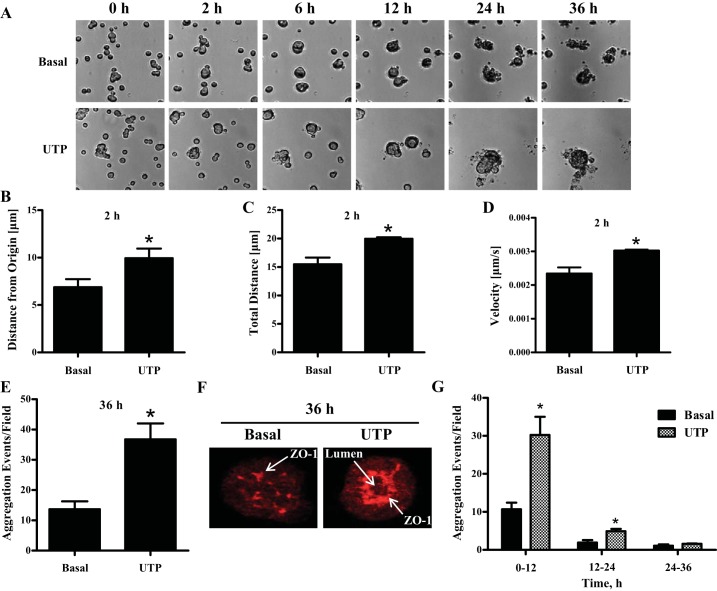
Hyposalivation resulting from salivary gland dysfunction leads to poor oral health and greatly reduces the quality of life of patients. Current treatments for hyposalivation are limited. However, regenerative medicine to replace dysfunctional salivary glands represents a revolutionary approach. The ability of dispersed salivary epithelial cells or salivary gland-derived progenitor cells to self-organize into acinar-like spheres or branching structures that mimic the native tissue holds promise for cell-based reconstitution of a functional salivary gland. However, the mechanisms involved in salivary epithelial cell aggregation and tissue reconstitution are not fully understood. This study investigated the role of the P2Y2 nucleotide receptor (P2Y2R), a G protein-coupled receptor that is upregulated following salivary gland damage and disease, in salivary gland reconstitution. In vitro results with the rat parotid acinar Par-C10 cell line indicate that P2Y2R activation with the selective agonist UTP enhances the self-organization of dispersed salivary epithelial cells into acinar-like spheres. Other results indicate that the P2Y2R-mediated response is dependent on epidermal growth factor receptor activation via the metalloproteases ADAM10/ADAM17 or the α5β1 integrin/Cdc42 signaling pathway, which leads to activation of the MAPKs JNK and ERK1/2. Ex vivo data using primary submandibular gland cells from wild-type and P2Y2R(-/-) mice confirmed that UTP-induced migratory responses required for acinar cell self-organization are mediated by the P2Y2R. Overall, this study suggests that the P2Y2R is a promising target for salivary gland reconstitution and identifies the involvement of two novel components of the P2Y2R signaling cascade in salivary epithelial cells, the α5β1 integrin and the Rho GTPase Cdc42.

Keywords: Cdc42 Rho GTPase; EGF receptor; P2Y2 nucleotide receptor; extracellular ATP; salivary gland reconstitution; α5β1 integrin.


Figures

Fig. 1.
Fig. 1.
UTP enhances Par-C10 cell aggregation and the formation of acinar-like spheres on growth factor reduced (GFR) Matrigel. A: Par-C10 single-cell suspensions were cultured on GFR-Matrigel for 4 h, then treated with or without UTP (100 μM) and monitored by time-lapse live cell imaging for 36 h, as described in materials and methods. B–D: the migration of single Par-C10 cells was monitored for 2 h, and the distance migrated from the origin (B), total distance traveled (C), and average velocity of single cells (D) were quantified with the tracking software provided with NIS-Elements imaging software. The data represent the means ± SE of results from at least 3 experiments. *P < 0.05, significant increase over basal levels (two-tailed t-test). E: quantification of the number of aggregation events in response to UTP (100 μM) after 36 h. F: after 36 h, UTP-treated Par-C10 cell aggregates formed acinar-like spheres that display lumen formation and an organized distribution of the tight junction protein ZO-1 (red) detected by immunofluorescence using rabbit anti-ZO-1 antibody, as previously described (7), features not observed in the Par-C10 cell aggregates formed under basal conditions. G: quantification of the aggregation events from 0–12 h, 12–24 h, and 24–36 h indicates that the majority of aggregation events take place in the first 12 h with or without UTP treatment. The data shown represent the means ± SE of results from at least 3 experiments. *P < 0.05, significant increase over basal levels (two-tailed t-test).
Fig. 2.
Fig. 2.
Inhibition of epidermal growth factor (EGF) receptor (EGFR) activation decreases UTP-induced enhancement of Par-C10 cell aggregation. A: Par-C10 single-cell suspensions plated on GFR-Matrigel for 4 h were pretreated with or without the EGFR inhibitor AG1478 (1 μM) for 2 h, then incubated with or without UTP (100 μM) or EGF (100 ng/ml). Par-C10 cell aggregates were monitored by time-lapse live cell imaging for 12 h. The data are expressed as percentages of the maximal number of aggregation events induced by UTP or EGF in the absence of AG1478 and represent the means ± SE of results from at least 3 experiments. **P < 0.01, ***P < 0.001, significant difference from the UTP- or EGF-induced response (two-tailed t-test). B: Par-C10 cells were serum-starved overnight, pretreated with or without AG1478 (1 μM) for 2 h, and then treated with or without UTP (100 μM) or EGF (100 ng/ml). Five minutes after UTP or EGF addition, protein extracts were prepared from Par-C10 cell aggregates and EGFR phosphorylation (Y1068) was determined by Western analysis. Representative blots are shown (top). Quantification of protein levels in blots (bottom) was performed using Quantity One software, as described in materials and methods. The data are expressed as the percentage increase in EGFR phosphorylation induced by UTP or EGF, compared with untreated controls, and represent the means ± SE of results from at least 3 experiments. *P < 0.05, ***P < 0.01, significant difference from the UTP- or EGF-induced response (two-tailed t-test).
Fig. 3.
Fig. 3.
Inhibition of metalloproteases ADAM10/ADAM17 decreases UTP-induced enhancement of Par-C10 cell aggregation and EGFR phosphorylation. A: Par-C10 single-cell suspensions plated on GFR-Matrigel for 4 h were pretreated with or without the ADAM10/ADAM17 inhibitor TAPI-2 (10 μM) for 2 h, then incubated with or without UTP (100 μM) or EGF (100 ng/ml). Par-C10 cell aggregates were monitored by time-lapse live cell imaging for 12 h. The data are expressed as percentages of the maximal number of aggregation events induced by UTP or EGF in the absence of TAPI-2 and represent the means ± SE of results from at least 3 experiments. ***P < 0.001, significant difference from the UTP- or EGF-induced response (two-tailed t-test). B: Par-C10 cells were serum-starved overnight, pretreated with or without TAPI-2 (10 μM) for 2 h, and then treated with or without UTP (100 μM) or EGF (100 ng/ml). Five minutes after UTP or EGF addition, protein extracts were prepared from Par-C10 cell aggregates and EGFR phosphorylation (Y1068) was determined by Western analysis. Representative blots are shown (top), where a black line represents noncontiguous lanes from the same gel. Quantification of protein levels in blots (bottom) was performed using Quantity One software, as described in materials and methods. The data are expressed as the percentage increase in EGFR phosphorylation induced by UTP or EGF, compared with untreated controls, and represent the means ± SE of results from at least 3 experiments. **P < 0.01, significant difference from the UTP- or EGF-induced response (two-tailed t-test).
Fig. 4.
Fig. 4.
Inhibition of the α5β1/Cdc42 signaling pathway decreases UTP-induced Par-C10 cell aggregation and EGFR phosphorylation, whereas RhoA inhibition increases basal cell aggregation. Par-C10 single-cell suspensions were plated on GFR-Matrigel for 4 h, pretreated for 2 h with or without α5β1 integrin function-blocking antibody (100 μg/ml) (A), the Cdc42 inhibitor ML141 (10 μM) (B, bottom), or the RhoA inhibitor SR3677 (10 μM) (C). Cells were then treated with or without UTP (100 μM) or EGF (100 ng/ml), as indicated, and cell aggregation was monitored by time-lapse live cell imaging for an additional 12 h. The data are expressed as percentages of the maximal number of aggregation events induced by UTP or EGF (A and B) or the total number of aggregation events (C). The data represent the means ± SE of results from at least 3 experiments. A and B: *P < 0.05, **P < 0.01, significant difference from the UTP- or EGF-induced response (two-tailed t-test). C: two-way ANOVA was performed followed by the Bonferroni test. *P < 0.05, **P < 0.01, significant difference in the number of aggregation events between SR3677-treated and untreated cells under basal conditions or SR3677-treated cells stimulated with or without UTP or EGF, as indicated. B, top: GTP binding by Cdc42 was determined in serum-starved Par-C10 cells treated with or without UTP (100 μM) for 1, 5, or 10 min, as described in materials and methods. D: Par-C10 cells were serum-starved overnight, pretreated with or without the Cdc42 inhibitor ML141 (10 μM) for 2 h, and then treated with or without UTP (100 μM) or EGF (100 ng/ml) for 5 min. EGFR phosphorylation (Y1068) was determined by Western analysis. A representative blot is shown (top), where a black line represents noncontiguous lanes from the same gel. Quantification of protein levels in blots (bottom) was performed using Quantity One software, as described in materials and methods. The data are expressed as the percentage increase in EGFR phosphorylation induced by UTP, compared with untreated controls, and represent the means ± SE of results from at least 3 experiments. *P < 0.05, significant difference from the UTP-induced response (two-tailed t-test).
Fig. 5.
Fig. 5.
UTP-induced enhancement of Par-C10 cell aggregation is dependent on the activation of JNK and ERK1/2 by the EGFR. A: Par-C10 cells were serum-starved overnight and treated with or without 100 μM UTP for 1, 5, 10, or 15 min. Protein extracts were subjected to SDS-PAGE, and p-JNK (Thr183/Tyr185), p-ERK1/2 (Thr202/Tyr204), and ERK1/2 (loading control) were detected by Western analysis. B: Par-C10 single-cell suspensions plated on GFR-Matrigel for 4 h were pretreated with or without the JNK inhibitor SP600125 (10 μM) or the MEK/ERK inhibitor U0126 (10 μM) for 2 h. Cells were then treated with or without UTP (100 μM), and cell aggregation was monitored by time-lapse live cell imaging for 12 h. The data are expressed as percentages of the maximal number of aggregation events induced by UTP and represent the means ± SE of results from at least 3 experiments. **P < 0.01, ***P < 0.001, significant difference from the UTP-induced response (two-tailed t-test). C: Par-C10 cells were pretreated for 2 h with or without the EGFR inhibitor AG1478 (1 μM) then treated with or without UTP (100 μM) for 5 min. Protein extracts were subjected to SDS-PAGE, and p-JNK (Thr183/Tyr185), p-ERK1/2 (Thr202/Tyr204), and ERK1/2 (loading control) were detected by Western analysis (representative blots are shown on the left, where a black line represents noncontiguous lanes from the same gel). Quantification of protein levels was performed (right), as described in materials and methods. The data are expressed as the percentage increase in JNK (Thr183/Tyr185) and ERK1/2 (Thr202/Tyr204) phosphorylation induced by UTP, compared with untreated control, and represent the means ± SE of results from at least 3 experiments. *P < 0.05, **P < 0.01, significant difference from the UTP-induced response (two-tailed t-test).
Fig. 6.
Fig. 6.
P2Y2 receptor (P2Y2R) mediates UTP-induced migration of primary submandibular gland (SMG) cell aggregates. A: P2Y2R mRNA was isolated from SMG cell aggregates from wild-type and P2Y2R−/− mice after 0, 24, 48, or 72 h in culture, as described in materials and methods. The data are expressed as fold increase in P2Y2R mRNA levels over the 0 time point and represent the means of ± SE of results from 4 experiments. *P < 0.05, ***P < 0.001, significant increase in P2Y2R mRNA expression, compared with the 0 time point (one-way ANOVA followed by Dunnett's test). B: changes in the intracellular free Ca2+ concentration ([Ca2+]i) induced by 100 μM UTP in SMG cell aggregates at 0 and 72 h in culture were determined, as described in materials and methods. The data represent the means ± SE of results from 7 experiments. ***P < 0.001, significant difference from the 0 time point (two-tailed t-test). C: primary SMGs isolated from wild-type and P2Y2R−/− mice were enzymatically dispersed and incubated for 3 days (37°C, 5% CO2, and 95% air) to enable upregulation of the P2Y2R. After 3 days, cells were serum-starved overnight, seeded on GFR-Matrigel for 8 h, and treated with or without 100 μM UTP. Cell aggregates of similar size were monitored by time-lapse live cell imaging for 24 h, and the point of origin (arrow) and the migration path (red line) are indicated. D–F: quantification of the distance migrated from the origin (D), the total distance traveled (E), and the average velocity (F) of aggregates throughout the first 4 h of the time course was performed with the tracking software provided with NIS-Elements imaging software. The data represent the means ± SE of results from at least 3 experiments. *P < 0.05, significant increase over basal levels (two-tailed t-test).
Fig. 7.
Fig. 7.
P2Y2R-induced migration of primary SMG cell aggregates is dependent on EGFR. Primary SMGs isolated from wild-type and P2Y2R−/− mice were enzymatically dispersed and incubated for 3 days (37°C, 5% CO2, and 95% air) to enable upregulation of the P2Y2R. After 3 days, cells were serum-starved overnight, seeded on GFR-Matrigel for 8 h, and pretreated for 2 h with or without the EGFR inhibitor AG1478 (1 μM). Cells were then treated with or without UTP (100 μM). Cell aggregates of similar size were monitored by time-lapse live cell imaging. Quantification of the distance migrated from the origin (A), the total distance traveled (B), and the average velocity (C) of aggregates during the first 4 h of the time course was performed with the tracking software provided with NIS-Elements imaging software. The data represent the means ± SE of results from at least 3 experiments. *P < 0.05, significant decrease from basal levels (two-tailed t-test).
Fig. 8.
Fig. 8.
Proposed mechanisms for P2Y2R-mediated enhancement of salivary epithelial cell aggregation and formation of acinar-like spheres. The P2Y2R enhances the aggregation of dispersed salivary epithelial cells into acinar-like spheres through the activation of the EGFR and subsequent downstream activation of JNK and ERK1/2. P2Y2R mediates EGFR activation through two distinct pathways: the first pathway involves P2Y2R-mediated activation of matrix metalloproteases (i.e., ADAM10/ADAM17), which cleave membrane-bound EGFR ligands (94) leading to the activation of the EGFR, and the second pathway involves P2Y2R-mediated activation of the Arg-Gly-Asp (RGD) binding α5β1 integrin, which leads to activation of the Rho GTPase Cdc42 that also activates the EGFR. RhoA activation has an inhibitory effect on the basal aggregation of dispersed Par-C10 salivary epithelial cells. P2Y2R, P2Y2 receptor; ADAM, a disintegrin and metalloproteinase; GFR, growth factor receptor; NRG, neuregulin; EGFR, epidermal growth factor receptor; RhoA, Ras homolog gene family member A; Cdc42, cell division control protein 42 homolog.

Similar articles

Cited by

References

    1. Ahn JS, Camden JM, Schrader AM, Redman RS, Turner JT. Reversible regulation of P2Y2 nucleotide receptor expression in the duct-ligated rat submandibular gland. Am J Physiol Cell Physiol 279: C286–C294, 2000. - PubMed
    1. Atkinson J, Fox P. Salivary gland dysfunction. Clin Geriatr Med 8: 499–511, 1992. - PubMed
    1. Atkinson JC, Baum BJ. Salivary enhancement: current status and future therapies. J Dent Educ 65: 1096–1101, 2001. - PubMed
    1. Atkinson JC, Wu AJ. Salivary gland dysfunction: causes, symptoms, treatment. J Am Dent Assoc 125: 409–416, 1994. - PubMed
    1. Auer KL, Contessa J, Brenz-Verca S, Pirola L, Rusconi S, Cooper G, Abo A, Wymann MP, Davis RJ, Birrer M. The Ras/Rac1/Cdc42/SEK/JNK/c-Jun cascade is a key pathway by which agonists stimulate DNA synthesis in primary cultures of rat hepatocytes. Mol Biol Cell 9: 561–573, 1998. - PMC - PubMed

Publication types

MeSH terms

LinkOut - more resources