

Pioglitazone, quercetin and hydroxy citric acid effect on hepatic biomarkers in Non Alcoholic Steatohepatitis
- PMID: 24761121
- PMCID: PMC3996753
- DOI: 10.4103/0974-8490.129037
Pioglitazone, quercetin and hydroxy citric acid effect on hepatic biomarkers in Non Alcoholic Steatohepatitis
Abstract
Background: Non alcoholic steatohepatitis (NASH), severe form of diseases belonging to the spectrum of the Non alcoholic fatty liver disease (NAFLD). It is an asymptomatic disease which leads to fibrosis and finally to cirrhosis, an end stage liver disease.
Objective: To study the effect of pioglitazone, quercetin and hydroxy citric acid on hepatic biomarkers and various biochemical parameters in experimentally induced non alcoholic steatohepatitis (NASH).
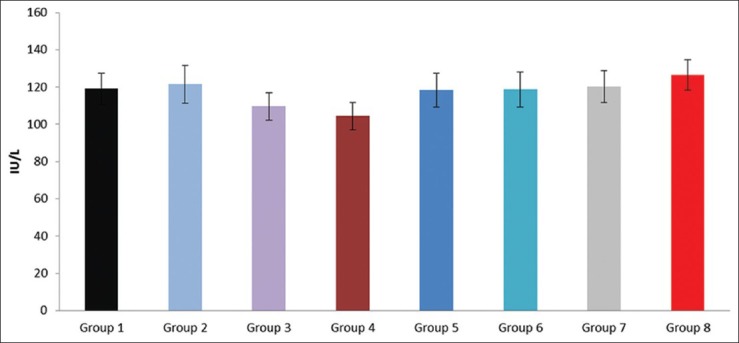
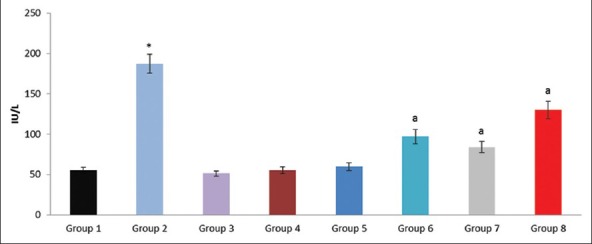
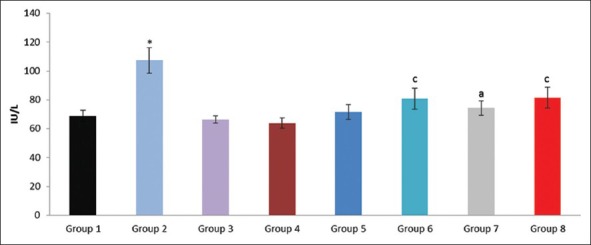
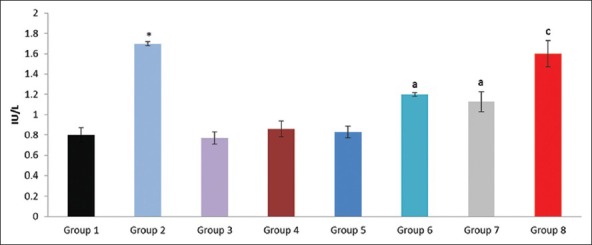
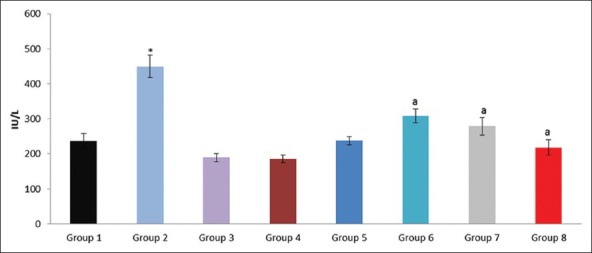
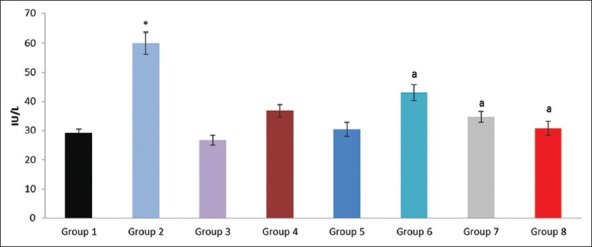
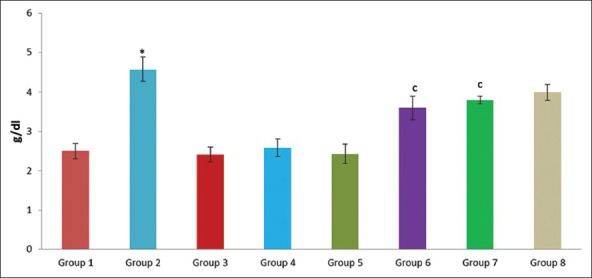
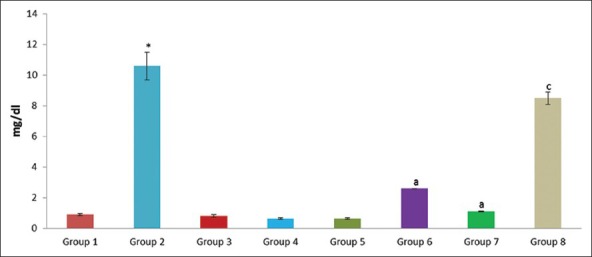
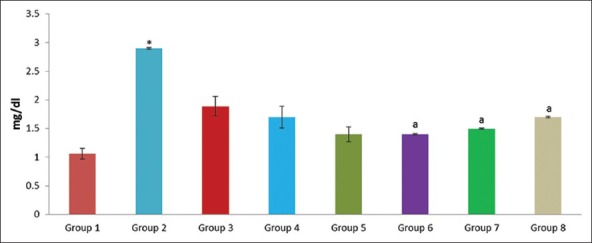
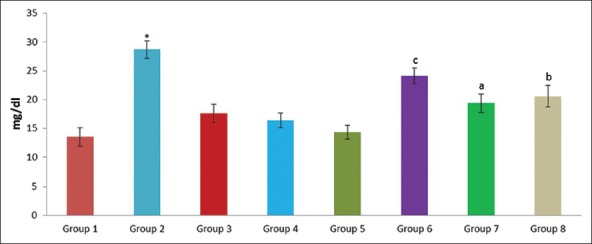
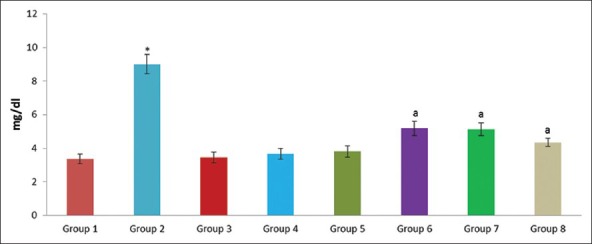
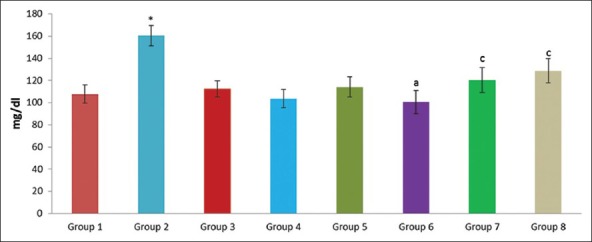
Materials and methods: Male Wister rats were divided into 8 groups. The activities of alkaline phosphatase (ALP), aspartate transaminase (AST), alanine transaminase (ALT), lactate dehydrogenase (LDH) and γ-Glutamyl Transferase (GGT) were assayed in serum. The levels of various other biochemical parameters such as serum albumin, total bilirubin, creatinine, urea, uric acid and glucose were also estimated in experimental NASH.
Results: The NASH group produced severe liver injury by significantly increasing the serum levels of ALT, AST, GGT and LDH compared with that of the control. However, the experimental NASH rats treated with pioglitazone, with quercetin and with hydroxy citric acid showed an obvious decrease in ALT, AST, GGT and LDH levels when compared with that of NASH induced group. A significant increase in the levels of albumin, creatinine, urea, uric acid, glucose and total bilirubin was noticed in experimentally induced NASH group (group 2) when compared to rats in control group (group 1).
Conclusion: It could be inferred from this study that, pioglitazone, quercetin and hydroxy citric acid may afford protection to the liver against NASH, as evidenced by the results of this study on the levels of various biochemical parameters such as glucose, urea, uric acid, creatinine and bilirubin. Whereas from the results of hepatic marker enzymes, it is evident that optimal protection was observed after quercetin treatment against experimental NASH whereas pioglitazone and hydroxy citric acid also confers protection to some extent against NASH.
Keywords: Biochemical parameters; experimentally induced NASH; hydroxy citric acid; liver marker enzymes; non alcoholic fatty liver disease; non alcoholic steatohepatitis; pioglitazone; quercetin.
Conflict of interest statement
Figures
Similar articles
-
Effect of pioglitazone, quercetin and hydroxy citric acid on extracellular matrix components in experimentally induced non-alcoholic steatohepatitis.Iran J Basic Med Sci. 2015 Aug;18(8):832-6. Iran J Basic Med Sci. 2015. PMID: 26557974 Free PMC article.
-
Pioglitazone, quercetin and hydroxy citric acid effect on cytochrome P450 2E1 (CYP2E1) enzyme levels in experimentally induced non alcoholic steatohepatitis (NASH).Eur Rev Med Pharmacol Sci. 2014;18(18):2736-41. Eur Rev Med Pharmacol Sci. 2014. PMID: 25317811
-
Effect of pioglitazone, quercetin, and hydroxy citric acid on vascular endothelial growth factor messenger RNA (VEGF mRNA) expression in experimentally induced nonalcoholic steatohepatitis (NASH).Turk J Med Sci. 2015;45(3):542-6. doi: 10.3906/sag-1404-136. Turk J Med Sci. 2015. PMID: 26281317
-
Efficacy of Off-Label Therapy for Non-alcoholic Fatty Liver Disease in Improving Non-invasive and Invasive Biomarkers: A Systematic Review and Network Meta-Analysis of Randomized Controlled Trials.Front Med (Lausanne). 2022 Feb 25;9:793203. doi: 10.3389/fmed.2022.793203. eCollection 2022. Front Med (Lausanne). 2022. PMID: 35280867 Free PMC article.
-
The use of statins alone, or in combination with pioglitazone and other drugs, for the treatment of non-alcoholic fatty liver disease/non-alcoholic steatohepatitis and related cardiovascular risk. An Expert Panel Statement.Metabolism. 2017 Jun;71:17-32. doi: 10.1016/j.metabol.2017.02.014. Epub 2017 Mar 4. Metabolism. 2017. PMID: 28521870 Review.
Cited by
-
Hepatoprotective and Anti-fibrotic Agents: It's Time to Take the Next Step.Front Pharmacol. 2016 Jan 7;6:303. doi: 10.3389/fphar.2015.00303. eCollection 2015. Front Pharmacol. 2016. PMID: 26779021 Free PMC article. Review.
-
Correlation between Mitochondrial Reactive Oxygen and Severity of Atherosclerosis.Oxid Med Cell Longev. 2016;2016:7843685. doi: 10.1155/2016/7843685. Epub 2015 Nov 9. Oxid Med Cell Longev. 2016. PMID: 26635912 Free PMC article.
-
Effects of Soothing Liver and Invigorating Spleen Recipes on the IKKβ-NF-κB Signaling Pathway in Kupffer Cells of Nonalcoholic Steatohepatitis Rats.Evid Based Complement Alternat Med. 2015;2015:687690. doi: 10.1155/2015/687690. Epub 2015 Oct 4. Evid Based Complement Alternat Med. 2015. PMID: 26504479 Free PMC article.
-
Human liver epigenetic alterations in non-alcoholic steatohepatitis are related to insulin action.Epigenetics. 2017 Apr 3;12(4):287-295. doi: 10.1080/15592294.2017.1294305. Epub 2017 Feb 23. Epigenetics. 2017. PMID: 28277977 Free PMC article.
-
Effect of pioglitazone, quercetin and hydroxy citric acid on extracellular matrix components in experimentally induced non-alcoholic steatohepatitis.Iran J Basic Med Sci. 2015 Aug;18(8):832-6. Iran J Basic Med Sci. 2015. PMID: 26557974 Free PMC article.
References
-
- Ratziu V, Charlotte F, Heurtier A, Gombert S, Giral P, Bruckert E, et al. Sampling variability of liver biopsy in nonalcoholic fatty liver disease. Gastroenterology. 2005;128:1898–906. - PubMed
-
- Clark JM. The epidemiology of nonalcoholic fatty liver disease in adults. J Clin Gastroenterol. 2006;40(Suppl 1):S5–10. - PubMed
-
- Cusi K. Non-alcoholic fatty liver disease in type 2 diabetes mellitus. Curr Opin Endocrinol Diabetes Obes. 2009;16:141–9. - PubMed
-
- Kakadiya J, Shah N. Effect of some synthetic and herbel drugs on tumer necrosis factor alpha in renal reperfusion induced renal damage in type 2 diabetic rats. Int J Preclinical Pharm Res. 2011;2:30–7.
-
- Molina MF, Sanchez-Reus I, Iglesias I, Benedi J. Quercetin, a flavonoid antioxidant, prevents and protects against ethanol-induced oxidative stress in mouse liver. Biol Pharm Bull. 2003;26:1398–402. - PubMed
LinkOut - more resources
Full Text Sources
Other Literature Sources
Miscellaneous