. 2014 Mar 27;5(4):1262-74.
doi: 10.1364/BOE.5.001262. eCollection 2014 Apr 1.

Reduced interhemispheric functional connectivity of children with autism spectrum disorder: evidence from functional near infrared spectroscopy studies

Affiliations

Reduced interhemispheric functional connectivity of children with autism spectrum disorder: evidence from functional near infrared spectroscopy studies

Huilin Zhu et al. Biomed Opt Express. .

Abstract

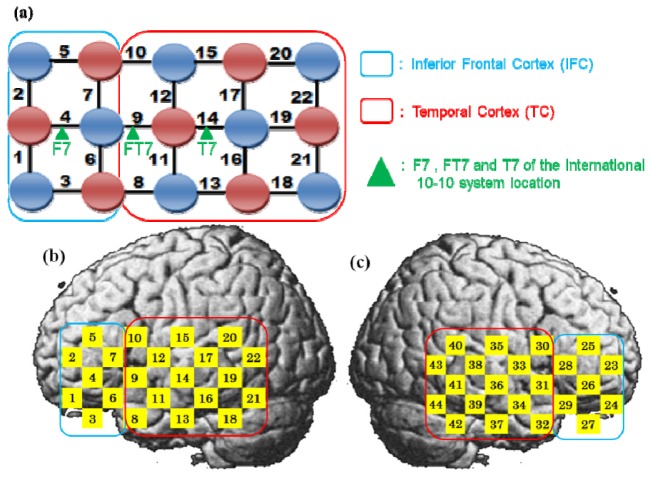
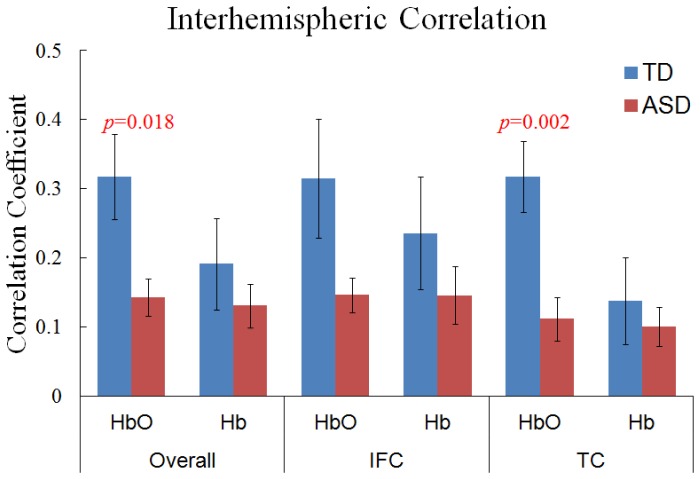
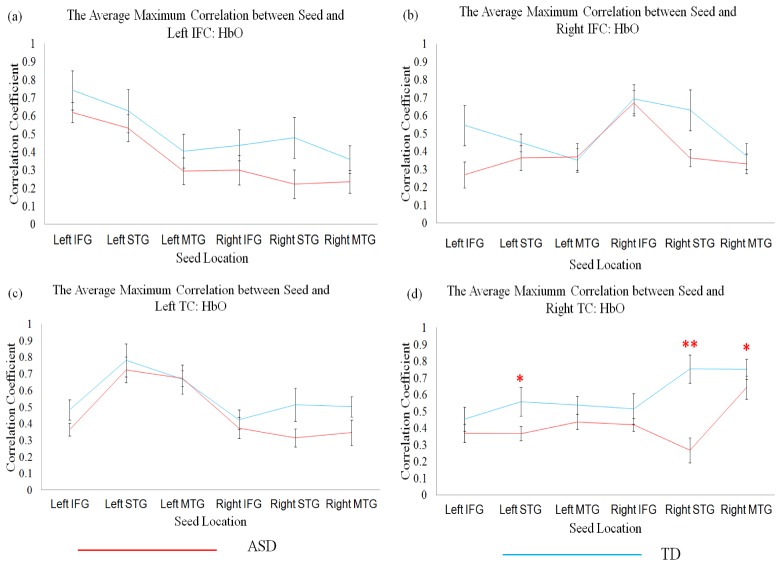
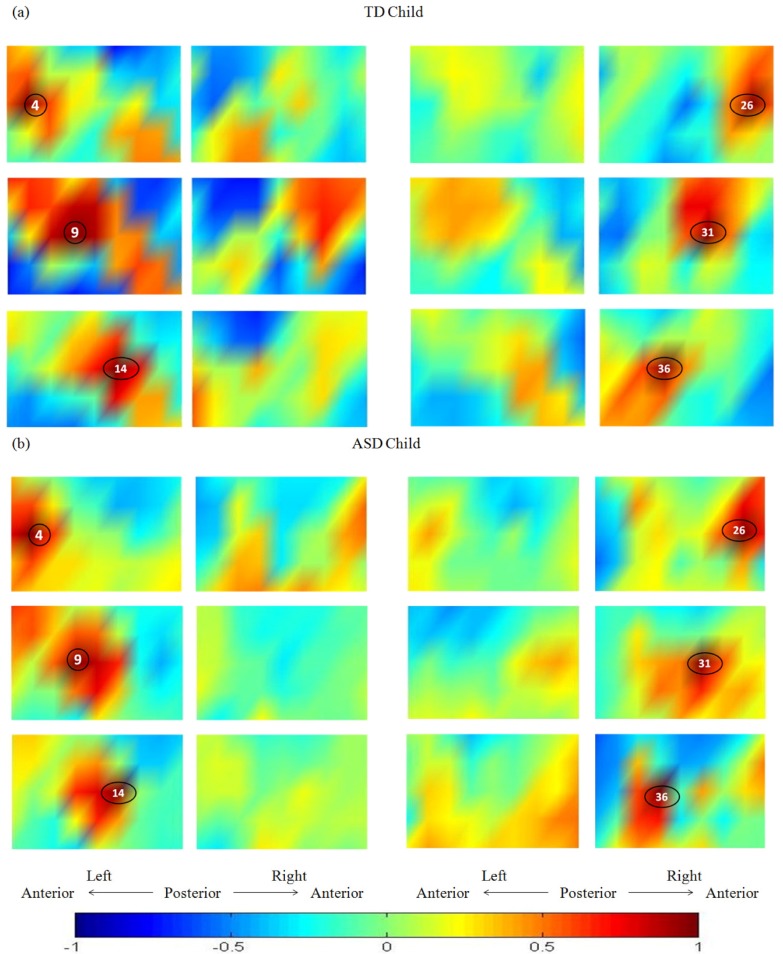
Autism spectrum disorder (ASD) is a neuro-developmental disorder, which has been associated with atypical neural synchronization. In this study, functional near infrared spectroscopy (fNIRS) was used to study the differences in functional connectivity in bilateral inferior frontal cortices (IFC) and bilateral temporal cortices (TC) between ASD and typically developing (TD) children between 8 and 11 years of age. As the first report of fNIRS study on the resting state functional connectivity (RSFC) in children with ASD, ten children with ASD and ten TD children were recruited in this study for 8 minute resting state measurement. Compared to TD children, children with ASD showed reduced interhemispheric connectivity in TC. Children with ASD also showed significantly lower local connectivity in bilateral temporal cortices. In contrast to TD children, children with ASD did not show typical patterns of symmetry in functional connectivity in temporal cortex. These results support the feasibility of using the fNIRS method to assess atypical functional connectivity of cortical responses of ASD and its potential application in diagnosis.

Keywords: (170.2655) Functional monitoring and imaging; (170.3880) Medical and biological imaging; (170.5380) Physiology.


Figures

Fig. 1
Fig. 1
The position of the optical probes (7 sources: red circles, 8 detectors: blue circles) in the left hemisphere. A black line connecting a source and a detector presents a data channel, which has a number alongside. 22 channels were used to cover inferior frontal cortex (IFC) and temporal cortex (TC). There were 7 channels (left hemisphere: from Channel 1 to Channel 7, right hemisphere: from Channel 23 to Channel 29) covering IFC and 15 channels (left hemisphere: from Channel 8 to Channel 22, right hemisphere: from Channel 30 to Channel 44) covering TC. IFC was boxed with the blue line and TC with the red line in Figs. 1(a)–1(c). Channels 4, 9, 14 (26, 31, 36 in symmetry in the right hemisphere) were located in the F7, FT7 and T7 in the international 10-10 system, respectively. The settings of the optical probes in the right hemisphere were identical to those of the probes in the left hemisphere through the anatomical symmetry. Channels’ numbers were marked on the left hemisphere (Fig. 1(b)) and right hemisphere (Fig. 1(c)) of the brain. We used an image of standard brain to visualize where the channels were mostly likely located in the cortex.
Fig. 2
Fig. 2
Interhemispheric correlation in ROIs of children with autism spectrum disorder (ASD, red, n = 10) and typically developing (TD) children (blue, n = 10). Error bars are standard error of mean across participants. Children with ASD showed significantly reduced interhemispheric correlation in overall (including all the channels, p = 0.018) and temporal cortex (TC, p = 0.002) than TDs in terms of HbO.
Fig. 3
Fig. 3
Inter-region correlation (HbO) between four ROIs and six seeds of children with ASD (red line, n = 10) and TDs (blue line, n = 10). Four ROIs are left interior frontal cortex (a), right inferior frontal cortex (b), left temporal cortex (c), and right temporal cortex (d). Six seeds are left inferior frontal gyrus (Channel 4), left superior temporal gyrus (Channel 9), left middle temporal gyrus (Chanel 14), right inferior frontal gyrus (Channel 26), right superior temporal gyrus (Channel 31), and right middle temporal gyrus (Channel 36). Error bars are standard error of mean across participants. Significant group difference was marked with red asterisks: * means 0.01<p<0.05, ** means p<0.01. The ASDs showed significantly weaker inter-region correlation between right TC and left STG, and weaker local correlation in right TC than controls (d).
Fig. 4
Fig. 4
HbO correlation maps for a typically developing (TD) child and an autism spectrum disorder (ASD) child. The selected seeds (Channel 4, Channel 9, Channel 14 in the left hemisphere and Channel 26, Channel 31, Channel 36 in the right hemisphere) were marked on the maps. (a) HbO correlation maps for a TD child (interhemispheric correlation value is 0.530). (b) HbO correlation maps for an ASD child (interhemispheric correlation value is 0.036). Color bar represents the strength of the correlation with the seed.

Similar articles

Cited by

References

    1. Jöbsis F. F., “Noninvasive, infrared monitoring of cerebral and myocardial oxygen sufficiency and circulatory parameters,” Science 198(4323), 1264–1267 (1977).10.1126/science.929199 - DOI - PubMed
    1. Villringer A., Chance B., “Non-invasive optical spectroscopy and imaging of human brain function,” Trends Neurosci. 20(10), 435–442 (1997).10.1016/S0166-2236(97)01132-6 - DOI - PubMed
    1. Villringer A., Planck J., Hock C., Schleinkofer L., Dirnagl U., “Near infrared spectroscopy (NIRS): a new tool to study hemodynamic changes during activation of brain function in human adults,” Neurosci. Lett. 154(1-2), 101–104 (1993).10.1016/0304-3940(93)90181-J - DOI - PubMed
    1. Tamura M., Hoshi Y., Okada F., “Localized near-infrared spectroscopy and functional optical imaging of brain activity,” Philos. Trans. R. Soc. Lond. B Biol. Sci. 352(1354), 737–742 (1997).10.1098/rstb.1997.0056 - DOI - PMC - PubMed
    1. Guo Z., Cai F., He S., “Optimization for Brain Activity Monitoring with Near Infrared Light in a Four-Layered Model of the Human Head,” Prog. Electromagnetics Res. 140, 277–295 (2013).10.2528/PIER13040203 - DOI

LinkOut - more resources