. 2014 Apr 25;33(1):35.
doi: 10.1186/1756-9966-33-35.

CD45RA-Foxp3high but not CD45RA+Foxp3low suppressive T regulatory cells increased in the peripheral circulation of patients with head and neck squamous cell carcinoma and correlated with tumor progression

Affiliations

CD45RA-Foxp3high but not CD45RA+Foxp3low suppressive T regulatory cells increased in the peripheral circulation of patients with head and neck squamous cell carcinoma and correlated with tumor progression

Wei Sun et al. J Exp Clin Cancer Res. .

Abstract

Background: T regulatory cells (Tregs) contribute to the progression of head and neck squamous cell carcinoma (HNSCC) by suppressing antitumor immunity. However, little is known regarding the functional heterogeneity of Tregs in HNSCC patients.

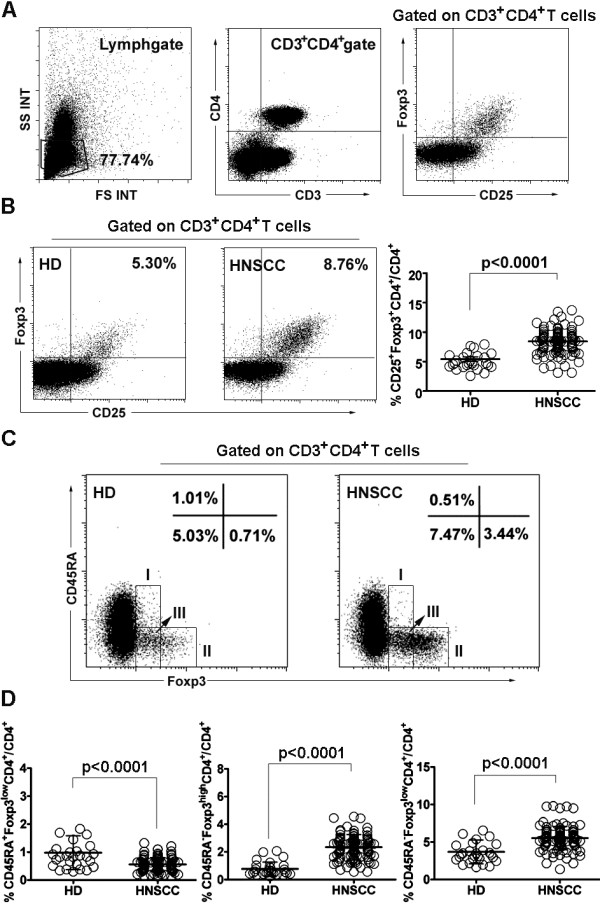
Methods: Using multicolor flow cytometry, the frequency of three Treg subsets, separated on the basis of CD45RA and Foxp3, from the peripheral circulation of newly-presenting HNSCC patients (19 oral cavity squamous cell carcinoma, 20 hypopharyngeal squamous cell carcinoma, 18 nasopharyngeal squamous cell carcinoma, 19 oropharyngeal squamous cell carcinoma, and 36 laryngeal squamous cell carcinoma) were assessed with regard to 31 healthy donors and clinicopathological features. Moreover, the functional capacity of each Treg subsets was evaluated based on CD45RA and CD25 expression.

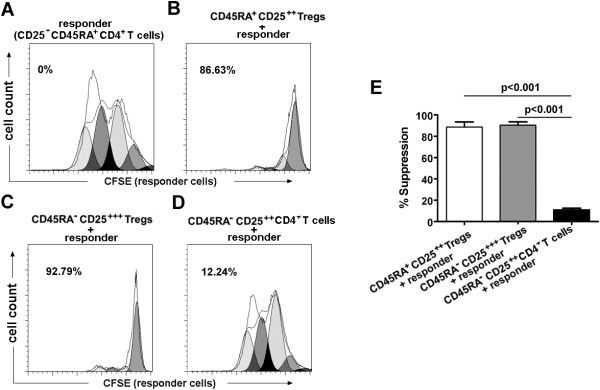
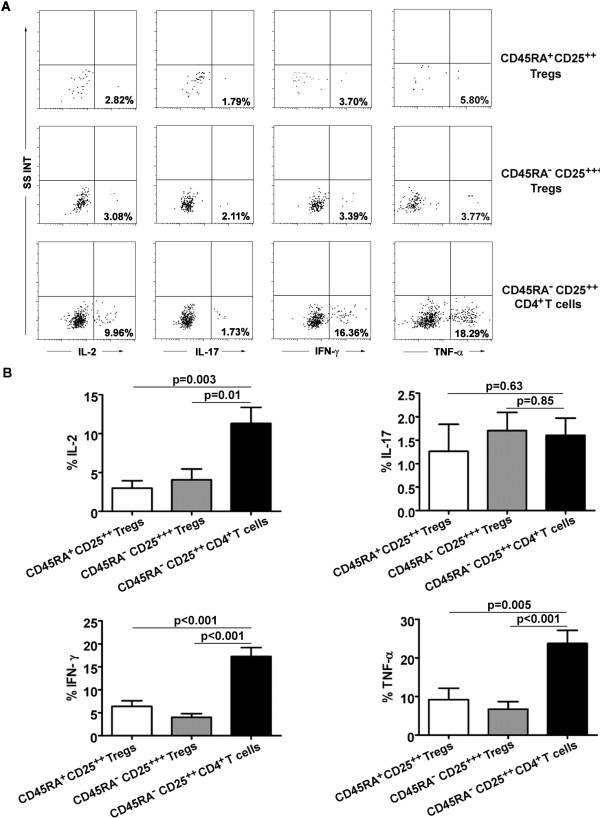
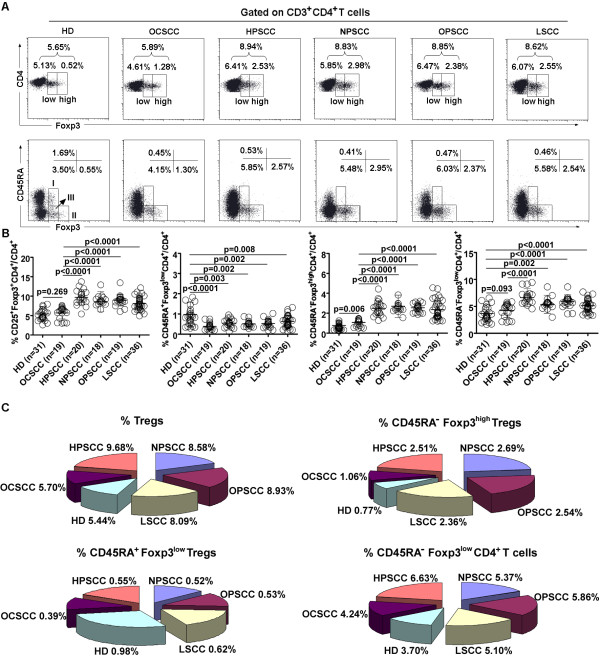
Results: The frequency of Tregs in the peripheral circulation of HNSCC patients as a whole cohort was higher than in healthy donors (P < 0.0001). However, the frequency of Tregs was similar between patients with oral cavity squamous cell carcinoma and healthy donors (P = 0.269). Further dividing Tregs into three subsets based on Foxp3 and CD45RA expression revealed that the frequency of CD45RA-Foxp3high Tregs and CD45RA-Foxp3lowCD4+ T cells in patients with HNSCC developing from different subsites was higher than in healthy donors (P < 0.0001, P < 0.0001), whereas the frequency of CD45RA+Foxp3low Tregs was lower than in healthy donors (P < 0.0001). Functionally study revealed that CD45RA-CD25+++ Tregs significantly inhibit the proliferation of CD4+CD25- T cells (P < 0.001) and secrete lower levels of cytokines (P < 0.01) compared with CD45RA-CD25++CD4+ T cells. Importantly, the frequency of CD45RA-Foxp3high Tregs positively correlate with tumor stage (P < 0.0001) and nodal status (P < 0.0001).

Conclusions: CD45RA-Foxp3high Tregs increase in the peripheral circulation of HNSCC patients, and correlate with tumor stage and nodal status; suggesting a role in tumor progression which may be manipulated by future immunotherapy.


Figures

Figure 1
Figure 1
Percentage of Treg subsets in 112 HNSCC patients. (A) Gating strategy used is illustrated. (B) Flow dot plots of Foxp3+CD25+ Tregs for one representative HD (left) and HNSCC patient (middle). Percentage (means ± SD) of Foxp3+CD25+ Tregs in HNSCC patients or HD (right). (C) Flow dot plots of each Treg subset (I: CD45RA+Foxp3low Tregs; II: CD45RA-Foxp3high Tregs; III: CD45RA-Foxp3lowCD4+ T cells) for one representative HD (left) and HNSCC patient (right). (D) Percentage (means ± SD) of each Treg subset in HNSCC patients or HD. HNSCC: head and neck squamous cell carcinoma. HD: healthy donors. Statistical comparisons were performed using the Mann–Whitney U-test.
Figure 2
Figure 2
Percentage of suppression by each Treg subset on the proliferation of responder T cells. (A-D) CFSE dilution by 1 × 104 labeled CD4+CD25-CD45RA+ T cells (responder T cells) assessed after 86 hr of TCR-stimulated co-culture with indicated Treg subset at a 1 to 1 ratio. Flow plots for one representative HNSCC patient. Percentage of suppression is indicated. In each histogram, the lines indicate the parent population (parent line) and the generation population (generation line) 1, 2, 3… from right to left. (E) The histogram represents the mean percentages of suppression ± SD (n = 12). HNSCC: head and neck squamous cell carcinoma. Statistical comparisons were performed using the Student’s t-test.
Figure 3
Figure 3
Cytokine production of each Treg subset. (A) Production of IL-17, IL-2, IFN-γ, and TNF-α by each Treg subset after stimulation with PMA + ionomycin, and percentage of cytokine-secreting cells in each Treg subset is shown. Data are representative of 9 separate experiments. (B) The histogram represents the cytokine expression profiles of each Treg subset. Statistical comparisons were performed using the Student’s t-test.
Figure 4
Figure 4
Percentage of Treg subsets in HNSCC patient subgroups. (A) Flow dot plots of Tregs (Foxp3low and Foxp3high Tregs) (top) and each Treg subset (I: CD45RA+Foxp3low Tregs; II: CD45RA-Foxp3high Tregs; III: CD45RA-Foxp3lowCD4+ T cells) (bottom) for one representative HD and patients with HPSCC, NPSCC, OPSCC, and LSCC. (B) Percentage (means ± SD) of Tregs and each Treg subset in HNSCC patient subgroups or HD. (C) Different proportions (means) of each Treg subset in HNSCC patient subgroups are presented. HD: healthy donors. OCSCC: oral squamous cell carcinoma. HPSCC: hypopharyngeal squamous cell carcinoma. NPSCC: nasopharyngeal squamous cell carcinoma. OPSCC: oropharyngeal squamous cell carcinoma. LSCC: laryngeal squanmous cell carcinoma. Statistical comparisons were performed using the Kruskal–Wallis test.

Similar articles

Cited by

References

    1. Parkin DM, Bray F, Ferlay J, Pisani P. Global cancer statistics, 2002. CA Cancer J Clin. 2005;55:74–108. doi: 10.3322/canjclin.55.2.74. - DOI - PubMed
    1. Curado MP, Hashibe M. Recent changes in the epidemiology of head and neck cancer. Curr Opin Oncol. 2009;21:194–200. doi: 10.1097/CCO.0b013e32832a68ca. - DOI - PubMed
    1. Forastiere A, Koch W, Trotti A, Sidransky D. Head and neck cancer. N Engl J Med. 2001;345:1890–1900. doi: 10.1056/NEJMra001375. - DOI - PubMed
    1. Alhamarneh O, Amarnath SM, Stafford ND, Greenman J. Regulatory T cells: what role do they play in antitumor immunity in patients with head and neck cancer? Head Neck. 2008;30:251–261. doi: 10.1002/hed.20739. - DOI - PubMed
    1. Khazaie K, von Boehmer H. The impact of CD4 + CD25+ Treg on tumor specific CD8+ T cell cytotoxicity and cancer. Semin Cancer Biol. 2006;16:124–136. doi: 10.1016/j.semcancer.2005.11.006. - DOI - PubMed

Publication types

MeSH terms