. 2014 Apr 24:11:82.
doi: 10.1186/1742-2094-11-82.

Macrophagic and microglial responses after focal traumatic brain injury in the female rat

Affiliations

Macrophagic and microglial responses after focal traumatic brain injury in the female rat

L Christine Turtzo et al. J Neuroinflammation. .

Abstract

Background: After central nervous system injury, inflammatory macrophages (M1) predominate over anti-inflammatory macrophages (M2). The temporal profile of M1/M2 phenotypes in macrophages and microglia after traumatic brain injury (TBI) in rats is unknown. We subjected female rats to severe controlled cortical impact (CCI) and examined the postinjury M1/M2 time course in their brains.

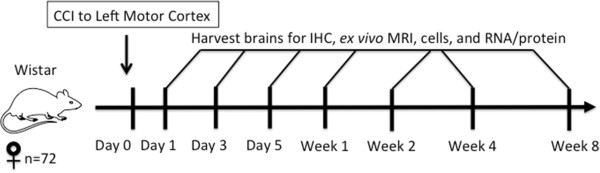
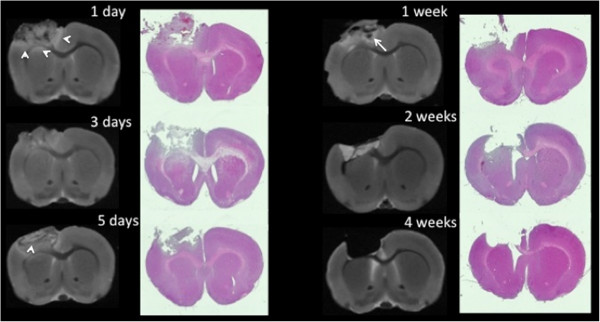
Methods: The motor cortex (2.5 mm left laterally and 1.0 mm anteriorly from the bregma) of anesthetized female Wistar rats (ages 8 to 10 weeks; N = 72) underwent histologically moderate to severe CCI with a 5-mm impactor tip. Separate cohorts of rats had their brains dissociated into cells for flow cytometry, perfusion-fixed for immunohistochemistry (IHC) and ex vivo magnetic resonance imaging or flash-frozen for RNA and protein analysis. For each analytical method used, separate postinjury times were included for 24 hours; 3 or 5 days; or 1, 2, 4 or 8 weeks.

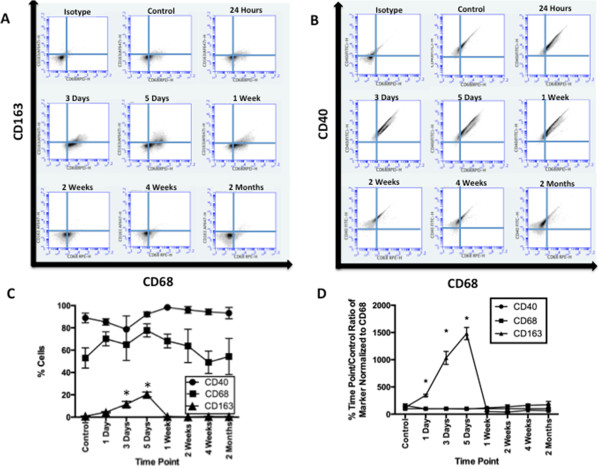
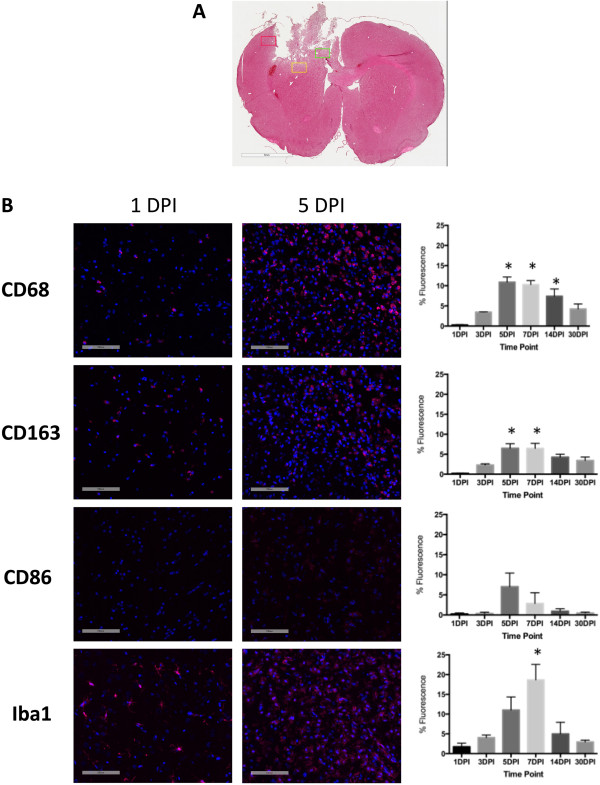
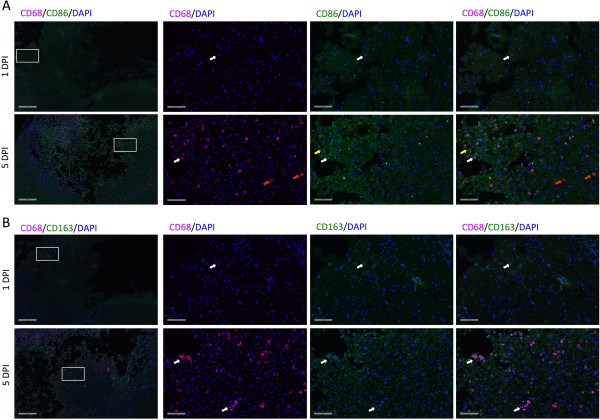
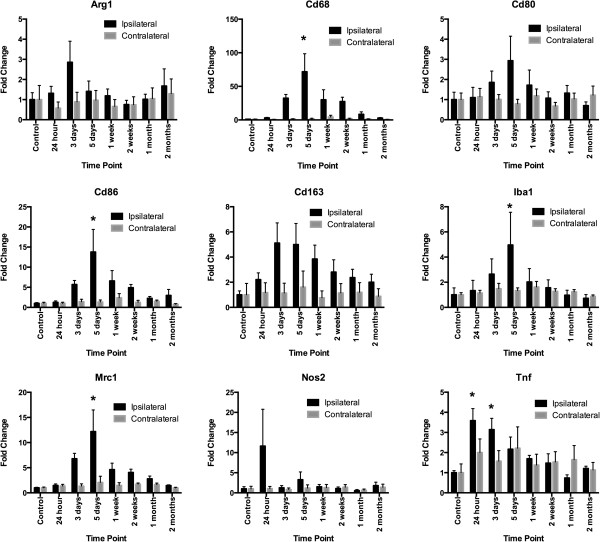
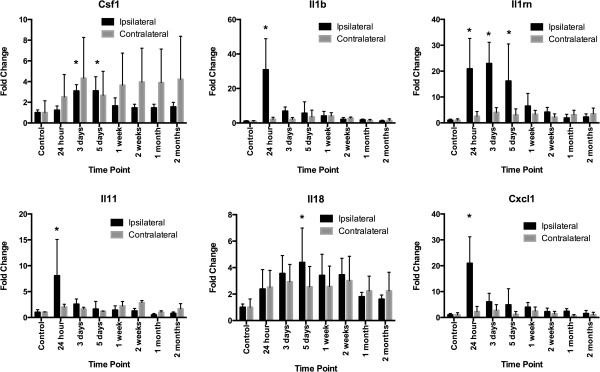
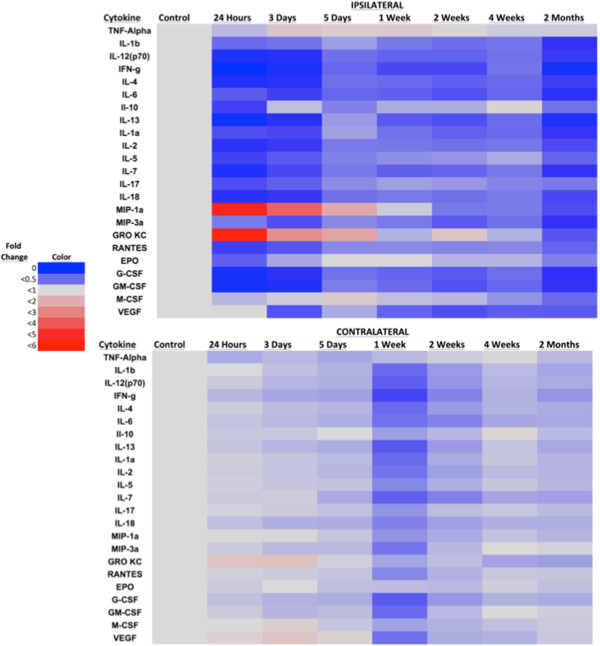
Results: By IHC, we found that the macrophagic and microglial responses peaked at 5 to 7 days post-TBI with characteristics of mixed populations of M1 and M2 phenotypes. Upon flow cytometry examination of immunological cells isolated from brain tissue, we observed that peak M2-associated staining occurred at 5 days post-TBI. Chemokine analysis by multiplex assay showed statistically significant increases in macrophage inflammatory protein 1α and keratinocyte chemoattractant/growth-related oncogene on the ipsilateral side within the first 24 hours after injury relative to controls and to the contralateral side. Quantitative RT-PCR analysis demonstrated expression of both M1- and M2-associated markers, which peaked at 5 days post-TBI.

Conclusions: The responses of macrophagic and microglial cells to histologically severe CCI in the female rat are maximal between days 3 and 7 postinjury. The response to injury is a mixture of M1 and M2 phenotypes.


Figures

Figure 1
Figure 1
Experimental design. Female Wistar rats (N = 72) underwent controlled cortical impact (CCI) to the left motor cortex on day 0. Their brains were harvested (n = 9 per time point) for immunohistochemistry (IHC), ex vivo magnetic resonance imaging (MRI), flow cytometry and RNA/protein analysis over a time course ranging from 1 day to 8 weeks postinjury. Naïve control rats were subjected to the same protocol.
Figure 2
Figure 2
Evolution of controlled cortical impact injury over time.Ex vivo magnetic resonance imaging (MRI) and corresponding hematoxylin and eosin stains demonstrate the controlled cortical impact (CCI) lesion’s extension from the cortex through the corpus callosum. By 4 weeks postinjury, the lesion had evolved into a cavity, with minimal further changes observed by 8 weeks (data not shown). Arrowheads on day 1 MRI scans indicate areas of edema. The arrow on the day 7 scan indicates an area of hemorrhage.
Figure 3
Figure 3
Time course of inflammatory and anti-inflammatory macrophage markers in cells examined by flow cytometry. Cells that stained for markers associated with macrophagic and microglial phenotypes were detected by flow cytometry of cells isolated from the lesion and/or perilesion area. (A) and (B) Comparison of cells stained with (A) general macrophage marker CD68 and anti-inflammatory macrophage (M2)-associated marker CD163 and (B) CD68 versus inflammatory macrophage (M1)-associated marker CD40 demonstrates a change in population occurring between 3 days and 1 week postinjury. (C) Statistically significant changes in the percentage of cells relative to controls that stained positive for the M2-associated marker CD163 were detected at 3 and 5 days postinjury (CD163: control = 0.9 ± 0.2%, 3 days = 12 ± 3%, 5 days = 20 ± 2%; F = 55.70). No significant differences were observed regarding the percentages of cells that stained for CD40 and CD68 over the time course. *P < 0.05. (D) Normalization of CD40 or CD163 to CD68 for flow cytometry data at each time point relative to controls allows better visualization of the degree of changes in M1 versus M2 ratios of macrophages. Data for CD163 are statistically significant at 1, 3 and 5 days postinjury by one-way analysis of variance (CD163: control = 120 ± 30%, 1 day = 350 ± 20%, 3 days = 1,000 ± 100%, 5 days = 1,500 ± 100%; F = 92.61). Error bars indicate standard errors of the mean. *P < 0.05.
Figure 4
Figure 4
Immunohistochemistry of macrophagic and microglial markers in brain tissue after traumatic brain injury over time. Maximum immunofluorescence detection of markers of macrophagic and microglial polarization occurred by 5 days postinjury (DPI). (A) Representative anatomical localization of the regions of interest (ROIs; rectangles) quantified for the immunofluorescence of each marker. These ROIs were examined for the same anatomical slices from each animal. Scale bar = 3 mm. (B) Quantification of immunofluorescence in ROIs and representative immunofluorescent images at 1 DPI and 5 DPI. For a given time point, the column represents the average of all three ROIs for each slice, as shown in (A). Iba1, Ionized calcium-binding adapter molecule 1. Error bars indicate standard errors of the mean. *P < 0.05 for time point relative to 1 DPI. Scale bars = 100 μm.
Figure 5
Figure 5
Immunohistochemistry of macrophages double-labeled for CD68/CD86 or CD68/CD163. CD68-positive macrophages express CD86 and CD163. (A) Representative immunofluorescent images double-labeled for CD68/CD86 and 4′,6-diamidino-2-phenylindole (DAPI) at 1 day postinjury (DPI) and 5 DPI. CD68-positive macrophages expressing the M1 marker CD86 were located predominantly in necrotic tissue (white arrows). Similarly, macrophages expressing only CD86 were located in necrotic tissue (yellow arrows). Macrophages expressing only CD68 were located in non-necrotic perilesional tissue (red arrows). (B) Representative immunofluorescent images double-labeled for CD68/CD163 and DAPI at 1 DPI and 5 DPI. All CD68-positive macrophages were positive for CD163 to varying degrees (white arrows). The leftmost images in each row display low-magnification (4X) images (scale bars = 500 μm), with the rectangles indicating the selected areas of higher magnification (20X) (scale bars = 100 μm) shown in the three accompanying images to the right.
Figure 6
Figure 6
Time course of inflammatory macrophage– and anti-inflammatory macrophage–associated gene expression in the brain after traumatic brain injury. Changes in RNA expression of inflammatory macrophage (M1) and anti-inflammatory macrophage (M2) macrophagic and microglial markers peaked in ipsilateral brain tissue at 5 days postinjury (DPI) as assessed by quantitative RT-PCR. Statistically significant fold changes at 5 DPI relative to control and contralateral sides occurred for CD68, CD86, ionized calcium-binding adapter molecule 1 (Iba1) and mannose receptor, C type 1 (Mrc1). Changes in CD80 were significant when ipsilateral sides were compared to contralateral sides, but not in controls. In contrast, expression of tumor necrosis factor α (Tnf) was highest at 24 hours and 3 DPI, but there were no statistically significant fold changes in RNA expression of arginase 1 (Arg1), CD80, CD163 or nitric oxide synthase 2 (Nos2). Error bars indicate standard errors of the mean. *P < 0.05.
Figure 7
Figure 7
Temporal changes in cytokine RNA expression in the brain after traumatic brain injury. RNA expression of pro- and anti-inflammatory cytokines in ipsilateral brain changes in the first days to 8 weeks after injury. Initial fold changes were detected using pooled samples for each time point in a rat cytokine array. Fold changes greater than fourfold relative to baseline were subsequently verified in custom arrays by running individual samples in triplicate for each time point. Maximum fold changes were occurred for interleukin 1β (Il1β), IL-11 (Il11) and chemokine (C-X-C motif) ligand 1 (Cxcl1) at 24 hours postinjury. Maximum fold changes occurred for colony-stimulating factor 1 (Csf1) 3 to 5 days postinjury, IL-18 (Il18) peaked at 5 days postinjury and IL-1 receptor antagonist (IL-1rn) was elevated from 24 hours to 5 days postinjury. Error bars indicate standard errors of the mean. *P < 0.05.
Figure 8
Figure 8
Changes in cytokine and chemokine protein expression after traumatic brain injury. The fold change protein expression of cytokines and growth factors assessed by multiplex assay decreased relative to expression in naïve controls in the combined lesion/perilesion area after injury, as summarized in the accompanying heat map. Chemokines macrophage inflammatory protein 1α (MIP-1a) and keratinocyte chemoattractant/growth-related oncogene (GRO KC) were the only proteins observed to have increased over the time course, peaking at 24 hours after injury, then decreasing. EPO, Erythropoietin; G-CSF, Granulocyte colony-stimulating factor; GM-CSF, Granulocyte-macrophage colony-stimulating factor; IFN-g, Interferon γ; IL, Interleukin; M-CSF, Macrophage colony-stimulating factor; RANTES, Regulated on activation, normal T cell expressed and secreted; TNF, Tumor necrosis factor; VEGF, Vascular endothelial growth factor. *P < 0.05.

References

    1. Faul M, Xu L, Wald MM, Coronado VG. Traumatic Brain Injury in the United States: Emergency Department Visits, Hospitalizations and Deaths 2002–2006. Atlanta, GA: US Department of Health and Human Services, Centers for Disease Control and Prevention, National Center for Injury Prevention and Control; 2010. Available at http://www.cdc.gov/traumaticbraininjury/pdf/blue_book.pdf; (accessed 15 April 2014)
    1. Bell RS, Vo AH, Neal CJ, Tigno J, Roberts R, Mossop C, Dunne JR, Armonda RA. Military traumatic brain and spinal column injury: a 5-year study of the impact blast and other military grade weaponry on the central nervous system. J Trauma. 2009;66(4 Suppl):S104–S111. - PubMed
    1. Roberts I, Schierhout G, Alderson P. Absence of evidence for the effectiveness of five interventions routinely used in the intensive care management of severe head injury: a systematic review. J Neurol Neurosurg Psychiatry. 1998;65:729–733. - PMC - PubMed
    1. Kumar A, Loane DJ. Neuroinflammation after traumatic brain injury: opportunities for therapeutic intervention. Brain Behav Immun. 2012;26:1191–1201. doi: 10.1016/j.bbi.2012.06.008. - DOI - PubMed
    1. Komohara Y, Ohnishi K, Kuratsu J, Takeya M. Possible involvement of the M2 anti-inflammatory macrophage phenotype in growth of human gliomas. J Pathol. 2008;216:15–24. doi: 10.1002/path.2370. - DOI - PubMed

Publication types

MeSH terms

LinkOut - more resources