

Sensitivity and specificity of substrate mapping: an in silico framework for the evaluation of electroanatomical substrate mapping strategies
- PMID: 24762029
- PMCID: PMC4107007
- DOI: 10.1111/jce.12444
Sensitivity and specificity of substrate mapping: an in silico framework for the evaluation of electroanatomical substrate mapping strategies
Abstract
Background: Voltage mapping is an important tool for characterizing proarrhythmic electrophysiological substrate, yet it is subject to geometric factors that influence bipolar amplitudes and thus compromise performance. The aim of this study was to characterize the impact of catheter orientation on the ability of bipolar amplitudes to accurately discriminate between healthy and diseased tissues.
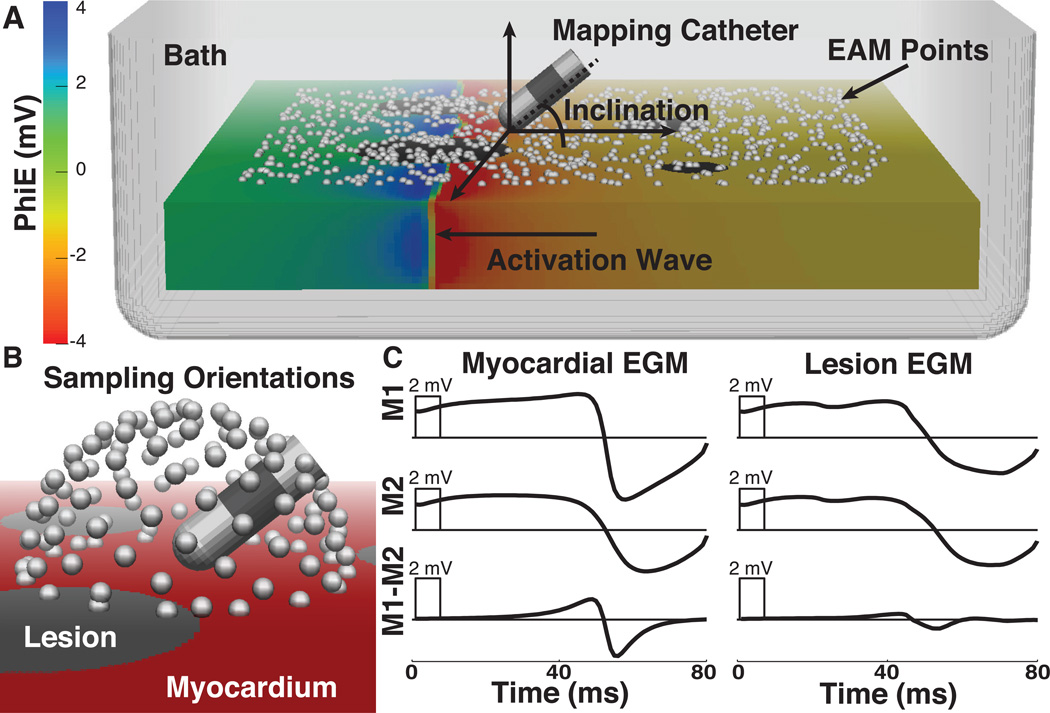
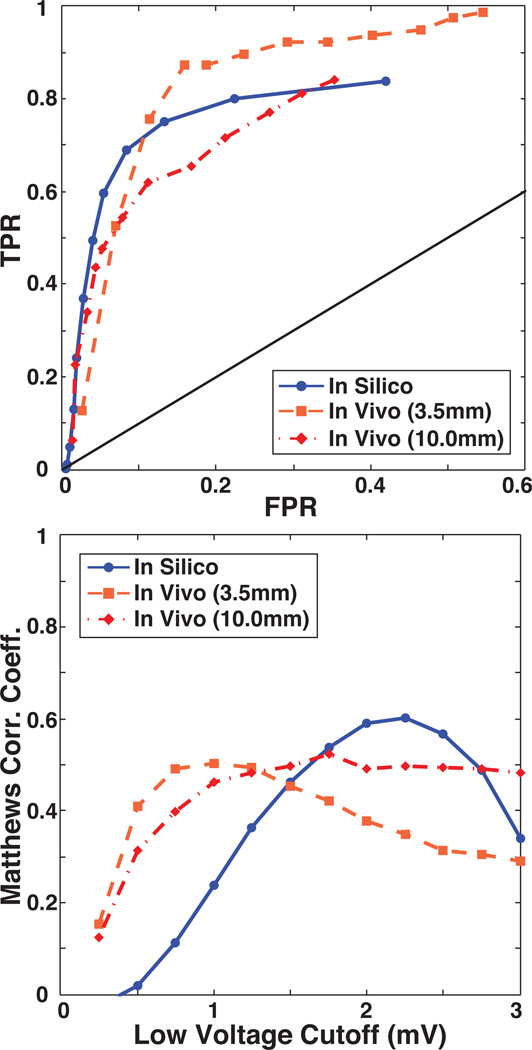
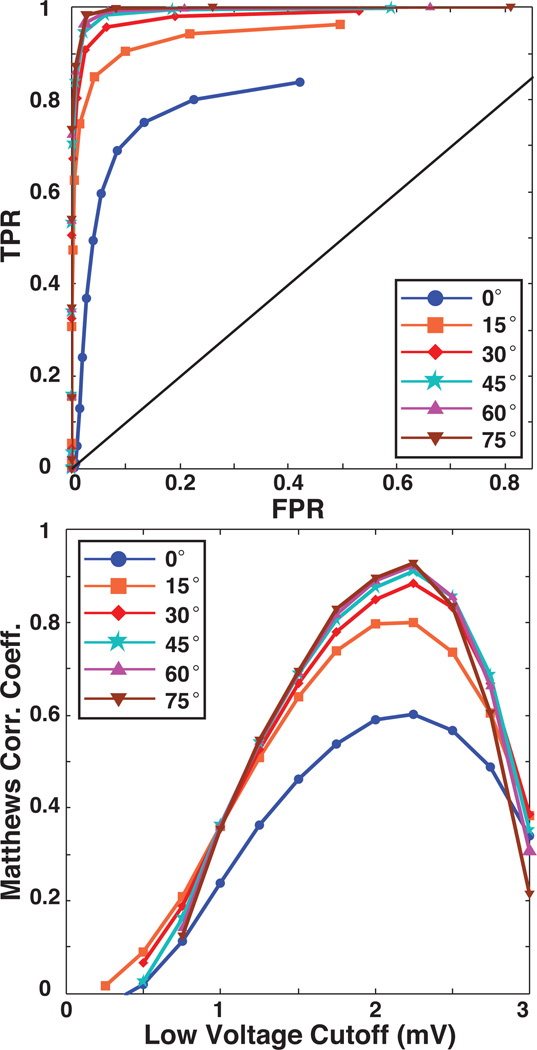
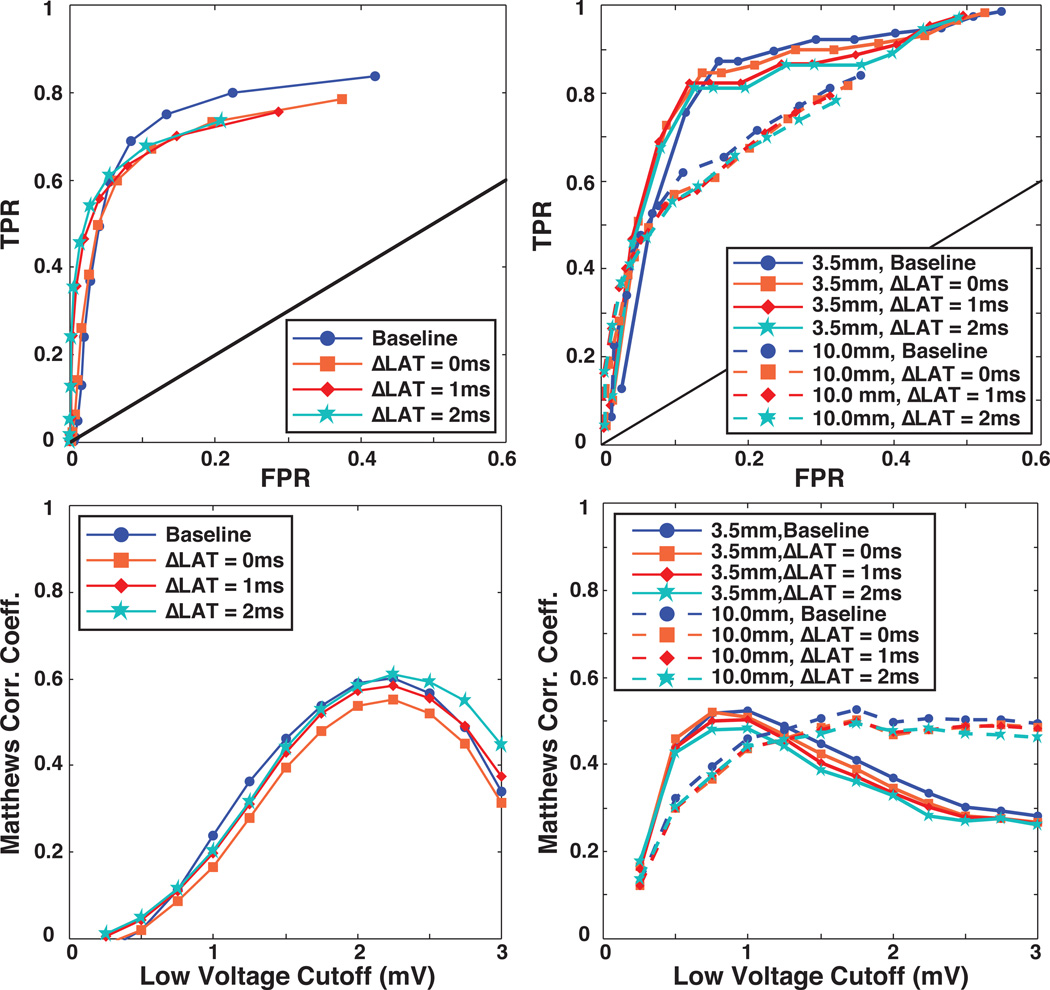
Methods and results: We constructed a 3-dimensional, in silico, bidomain model of cardiac tissue containing transmural lesions of varying diameter. A planar excitation wave was stimulated and electrograms were sampled with a realistic catheter model at multiple positions and orientations. We carried out validation studies in animal experiments of acute ablation lesions mapped with a clinical mapping system. Bipolar electrograms sampled at higher inclination angles of the catheter with respect to the tissue demonstrated improvements in both sensitivity and specificity of lesion detection. Removing low-voltage electrograms with concurrent activation of both electrodes, suggesting false attenuation of the bipolar electrogram due to alignment with the excitation wavefront, had little effect on the accuracy of voltage mapping.
Conclusions: Our results demonstrate possible mechanisms for the impact of catheter orientation on voltage mapping accuracy. Moreover, results from our simulations suggest that mapping accuracy may be improved by selectively controlling the inclination of the catheter to record at higher angles with respect to the tissue.
Keywords: bipolar electrogram; computer-based model; electroanatomical mapping; voltage mapping.
© 2014 Wiley Periodicals, Inc.
Figures
Similar articles
-
Multiple factors influence the morphology of the bipolar electrogram: An in silico modeling study.PLoS Comput Biol. 2019 Apr 5;15(4):e1006765. doi: 10.1371/journal.pcbi.1006765. eCollection 2019 Apr. PLoS Comput Biol. 2019. PMID: 30951529 Free PMC article.
-
Electrophysiological characteristics of the earliest activation site in idiopathic right ventricular outflow tract arrhythmias under mini-electrode mapping.J Cardiovasc Electrophysiol. 2019 May;30(5):642-650. doi: 10.1111/jce.13856. Epub 2019 Jan 31. J Cardiovasc Electrophysiol. 2019. PMID: 30680820
-
Three-dimensional mapping in the electrophysiological laboratory.Arch Cardiovasc Dis. 2018 Jun-Jul;111(6-7):456-464. doi: 10.1016/j.acvd.2018.03.013. Epub 2018 Jun 7. Arch Cardiovasc Dis. 2018. PMID: 29887403 Review.
-
Teaching points with 3-dimensional mapping of cardiac arrhythmia: how to overcome potential pitfalls during substrate mapping?Circ Arrhythm Electrophysiol. 2011 Dec;4(6):e72-5. doi: 10.1161/CIRCEP.110.960369. Circ Arrhythm Electrophysiol. 2011. PMID: 22203663 No abstract available.
-
Interventional cardiac magnetic resonance imaging in electrophysiology: advances toward clinical translation.Circ Arrhythm Electrophysiol. 2015 Feb;8(1):203-11. doi: 10.1161/CIRCEP.114.002371. Circ Arrhythm Electrophysiol. 2015. PMID: 25691554 Review. No abstract available.
Cited by
-
Substrate Mapping and Ablation for Ventricular Tachycardia in Patients with Structural Heart Disease: How to Identify Ventricular Tachycardia Substrate.J Innov Card Rhythm Manag. 2019 Mar 15;10(3):3565-3580. doi: 10.19102/icrm.2019.100302. eCollection 2019 Mar. J Innov Card Rhythm Manag. 2019. PMID: 32477720 Free PMC article. Review.
-
Sinus rhythm voltage fingerprinting in patients with mitral valve disease using a high-density epicardial mapping approach.Europace. 2021 Mar 8;23(3):469-478. doi: 10.1093/europace/euaa336. Europace. 2021. PMID: 33432326 Free PMC article.
-
Approaching Ventricular Tachycardia Ablation in 2024: An Update on Mapping and Ablation Strategies, Timing, and Future Directions.J Clin Med. 2024 Aug 24;13(17):5017. doi: 10.3390/jcm13175017. J Clin Med. 2024. PMID: 39274230 Free PMC article. Review.
-
Multiple factors influence the morphology of the bipolar electrogram: An in silico modeling study.PLoS Comput Biol. 2019 Apr 5;15(4):e1006765. doi: 10.1371/journal.pcbi.1006765. eCollection 2019 Apr. PLoS Comput Biol. 2019. PMID: 30951529 Free PMC article.
-
Identification of Low-Voltage Areas: A Unipolar, Bipolar, and Omnipolar Perspective.Circ Arrhythm Electrophysiol. 2021 Jul;14(7):e009912. doi: 10.1161/CIRCEP.121.009912. Epub 2021 Jun 18. Circ Arrhythm Electrophysiol. 2021. PMID: 34143644 Free PMC article.
References
-
- Marchlinski FE, Callans DJ, Gottlieb CD, Zado E. Linear ablation lesions for control of unmappable ventricular tachycardia in patients with ischemic and nonischemic cardiomyopathy. Circulation. 2000;101:1288–1296. - PubMed
-
- Nademanee K, McKenzie J, Kosar E, Schwab M, Sunsaneewitayakul B, Vasavakul T, Khunnawat C, Ngarmukos T. A new approach for catheter ablation of atrial fibrillation: mapping of the electrophysiologic substrate. J Am Coll Cardiol. 2004;43:2044–2053. - PubMed
-
- Sanders P, Berenfeld O, Hocini M, Jaïs P, Vaidyanathan R, Hsu L-F, Garrigue S, Takahashi Y, Rotter M, Sacher F, Scavée C, Ploutz-Snyder R, Jalife J, Haïssaguerre M. Spectral analysis identifies sites of high-frequency activity maintaining atrial fibrillation in humans. Circulation. 2005;112:789–797. - PubMed
-
- Oakes RS, Badger TJ, Kholmovski EG, Akoum N, Burgon NS, Fish EN, Blauer J, Rao SN, DiBella EVR, Segerson NM, Daccarett M, Windfelder J, McGann CJ, Parker D, MacLeod RS, Marrouche NF. Detection and quantification of left atrial structural remodeling with delayed-enhancement magnetic resonance imaging in patients with atrial fibrillation. Circulation. 2009;119:1758–1767. - PMC - PubMed
-
- Codreanu A, Odille F, Aliot E, Marie P-Y, Magnin-Poull I, Andronache M, Mandry D, Djaballah W, Régent D, Felblinger J, de Chillou C. Electroanatomic Characterization of Post-Infarct Scars. J Am Coll Cardio. 2008;52:839–842. - PubMed
MeSH terms
Grants and funding
LinkOut - more resources
Full Text Sources
Other Literature Sources
Medical
