. 2014 Jun;124(6):2611-25.
doi: 10.1172/JCI69815. Epub 2014 Apr 24.

Mesenchymal gene program-expressing ovarian cancer spheroids exhibit enhanced mesothelial clearance

Mesenchymal gene program-expressing ovarian cancer spheroids exhibit enhanced mesothelial clearance

Rachel A Davidowitz et al. J Clin Invest. 2014 Jun.

Abstract

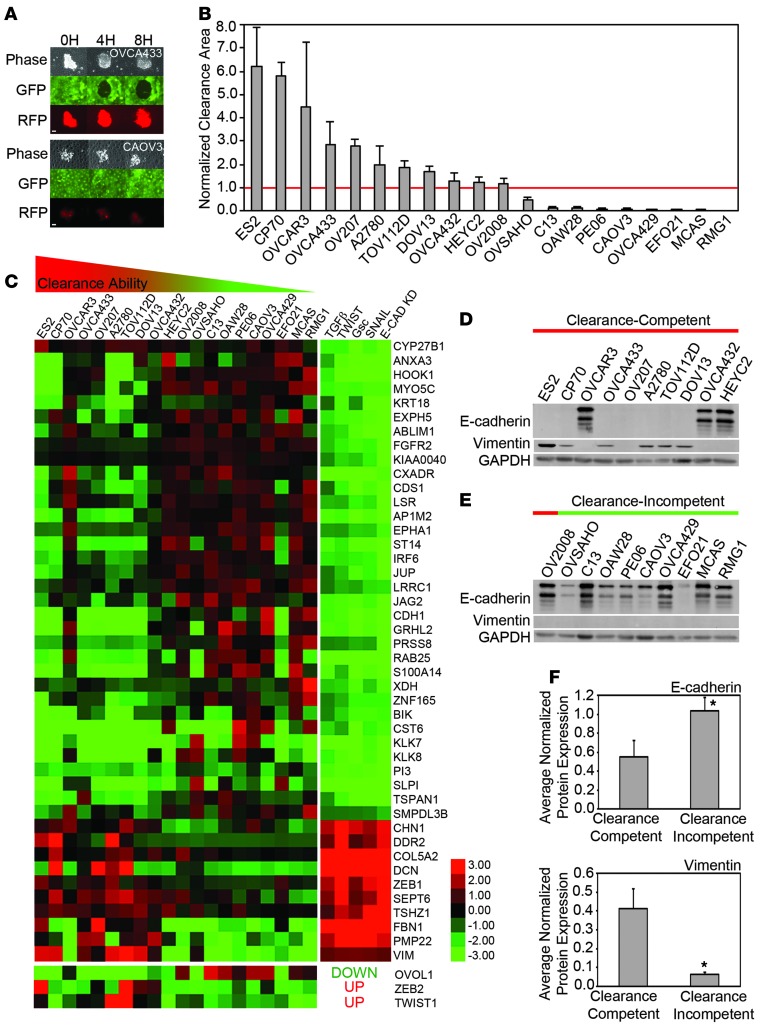
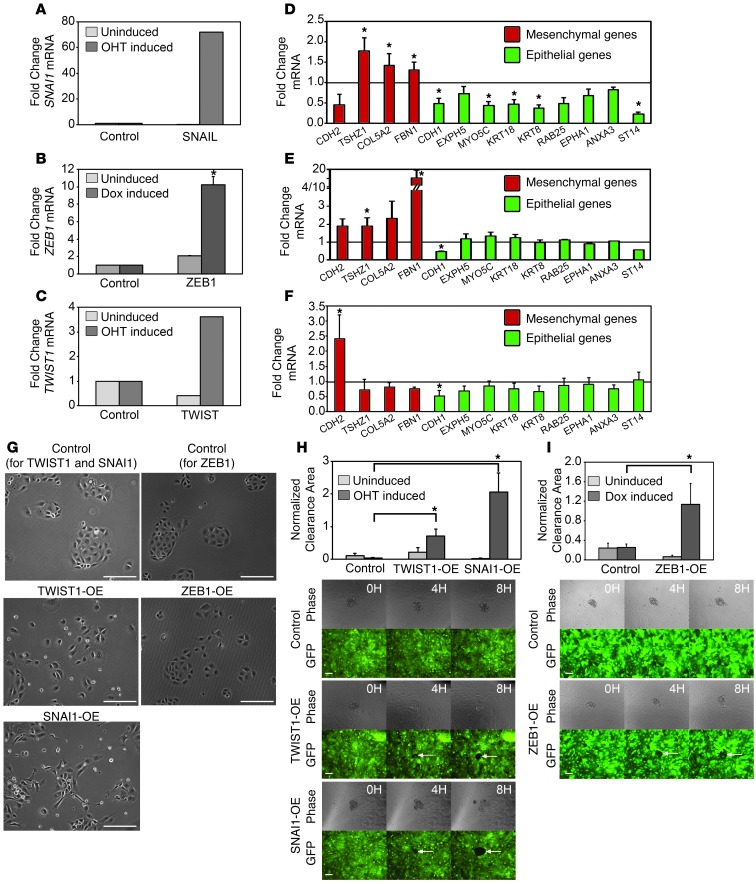
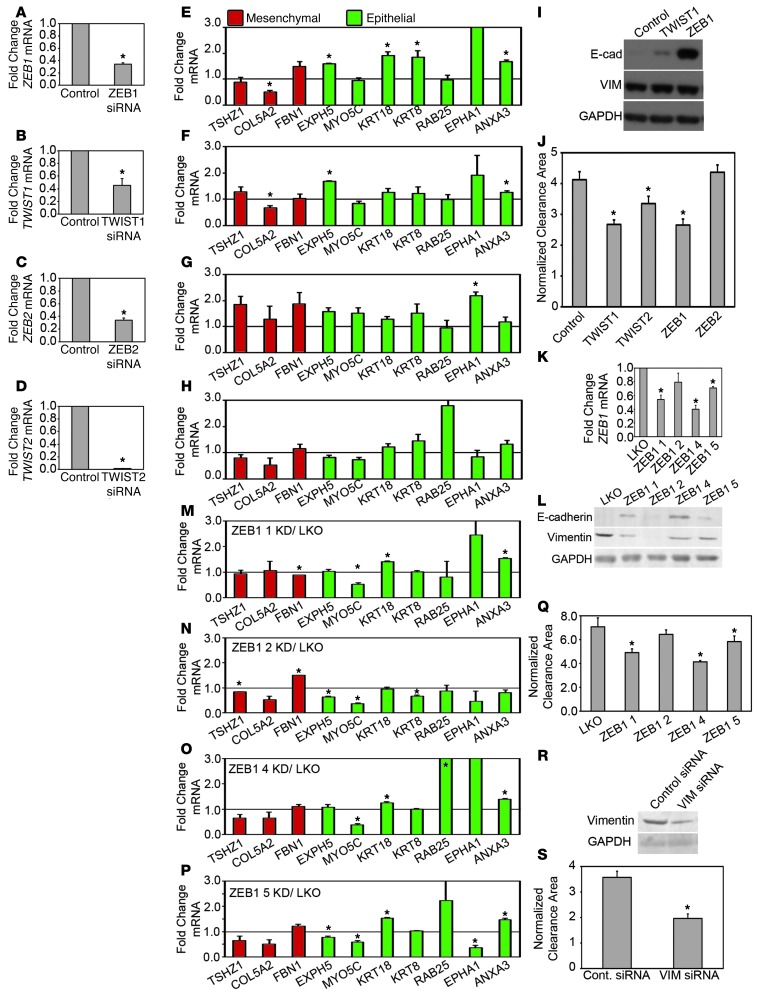
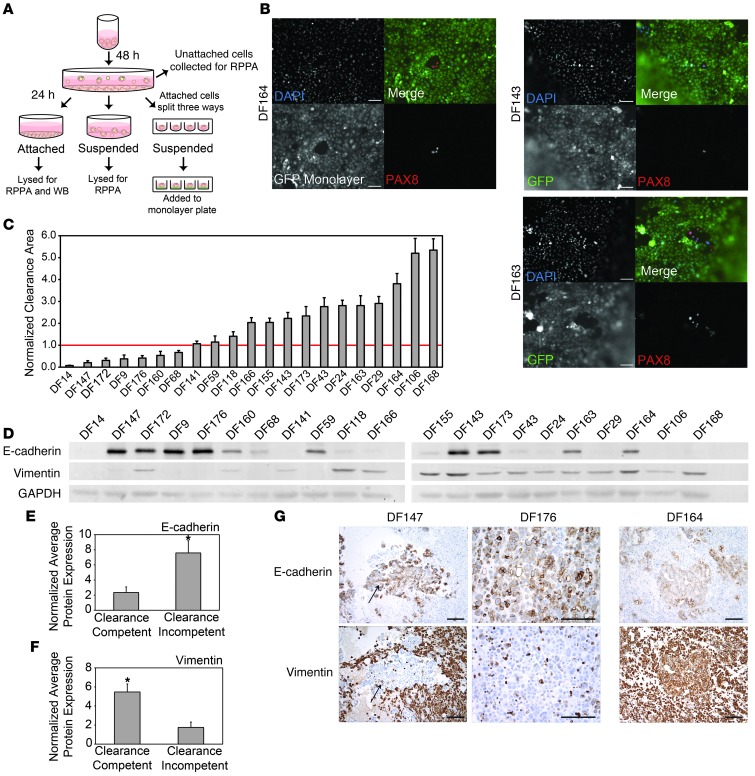
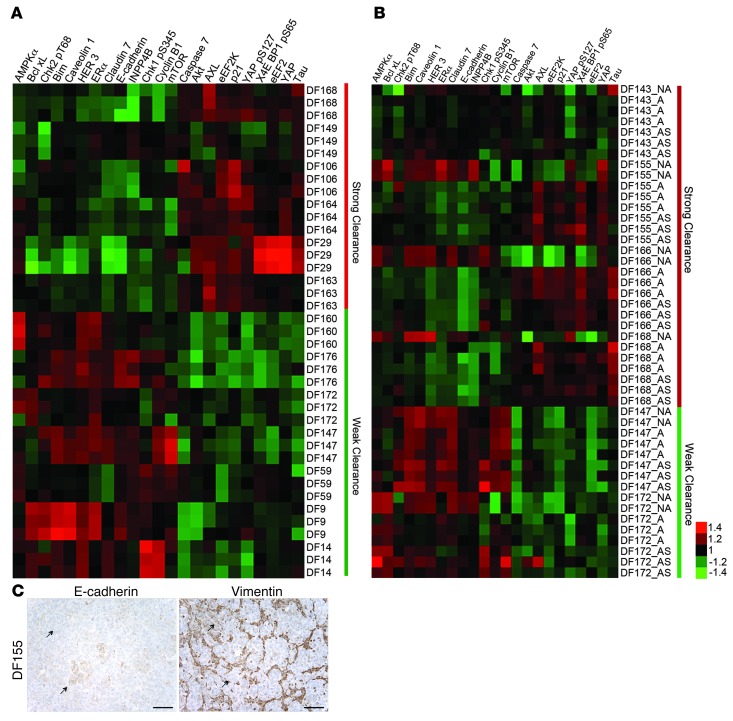
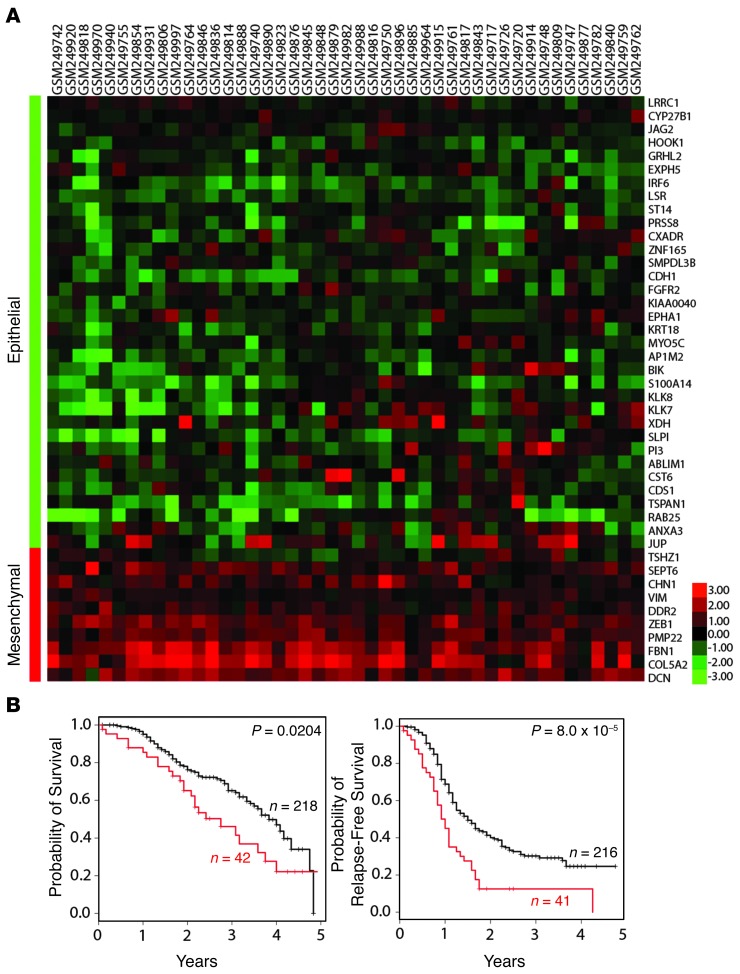
Metastatic dissemination of ovarian tumors involves the invasion of tumor cell clusters into the mesothelial cell lining of peritoneal cavity organs; however, the tumor-specific factors that allow ovarian cancer cells to spread are unclear. We used an in vitro assay that models the initial step of ovarian cancer metastasis, clearance of the mesothelial cell layer, to examine the clearance ability of a large panel of both established and primary ovarian tumor cells. Comparison of the gene and protein expression profiles of clearance-competent and clearance-incompetent cells revealed that mesenchymal genes are enriched in tumor populations that display strong clearance activity, while epithelial genes are enriched in those with weak or undetectable activity. Overexpression of transcription factors SNAI1, TWIST1, and ZEB1, which regulate the epithelial-to-mesenchymal transition (EMT), promoted mesothelial clearance in cell lines with weak activity, while knockdown of the EMT-regulatory transcription factors TWIST1 and ZEB1 attenuated mesothelial clearance in ovarian cancer cell lines with strong activity. These findings provide important insights into the mechanisms associated with metastatic progression of ovarian cancer and suggest that inhibiting pathways that drive mesenchymal programs may suppress tumor cell invasion of peritoneal tissues.


Figures

Figure 1
Figure 1. Ovarian cancer cell line spheroids display differential clearance ability that correlates with epithelial and mesenchymal marker expression.
(A) Representative images from mesothelial clearance assays of 2 clearance-competent or clearance-incompetent ovarian cancer cell lines. The extent of clearance of a ZT mesothelial monolayer (green) by OVCA433 or CAOV3 ovarian cancer spheroids (red) was imaged at 0, 4, and 8 hours after coincubation. (B) Quantification of clearance by ovarian tumor cell lines. Clearance area was measured in 20 established ovarian cancer cell lines by coculturing preformed multicellular spheroids with ZT mesothelial cell monolayers. After 8 hours of coincubation, the negative space created in the mesothelial monolayer by the ovarian cancer spheroid was measured and divided by the initial size of the ovarian cancer spheroid at time 0 to determine the normalized clearance area. Cell lines with a normalized clearance area >1 were classified as clearance competent and <1 were classified as clearance incompetent. >10 spheroids scored over 2 replicates. (C) Analysis of enrichment of mRNAs associated with EMT. Heat map showing mRNA expression of genes associated with the Taube EMT core signature and 3 additional transcription factors that are significantly (P < 0.05) differentially expressed in the clearance-competent and clearance-incompetent ovarian tumor cell lines. Ovarian cancer cell line data in the left column and manipulations to HMLE cells from Taube et al. (25) in the right column. Both data sets were log2 transformed for visualization. (D) Western blot analysis of E-cadherin and vimentin expression in the 20 established ovarian cancer cell lines. (E and F) Average (E) E-cadherin or (F) vimentin protein expression levels in clearance-competent and clearance-incompetent cell lines measured by densitometry:. Error bars denote SEM. *P < 0.05, Student’s t test. Scale bar: 100 μm.
Figure 2
Figure 2. Overexpression of EMT transcription factors increases mesothelial clearance ability.
(AC) qRT-PCR measurements of mRNA levels of (A) SNAI1, (B) ZEB1, or (C) TWIST1 in MCAS cells infected with the control WZL-empty vector, WZL-TWIST, or WZL-SNAI1 or MCAS rTTA cells infected with control FUW-LPT2 or FUW-LPT2 ZEB1. TWIST1 and SNAI1 cells were treated with vehicle (uninduced) or 20 nM 4-OHT, while ZEB1 cells treated with vehicle or 1 μg/ml doxycycline. (DF) qRT-PCR measurements of mRNA levels of EMT markers in (D) TWIST1-, (E) ZEB1-, or (F) SNAI1-overexpressing cells. Measurements were normalized to RPLPO mRNA levels and expressed as fold changes compared to controls. Data are shown as the mean of 3 biological replicates for each condition. Each biological replicate was derived from an average of 3 technical replicates. (G) Phase-contrast images of control, TWIST1-, ZEB1-, and SNAI1-overexpressing MCAS cells induced with 20 nM 4-OHT or 1 μg/ml doxycycline for 7 to 14 days. Original magnification, ×10. (H and I) Normalized average clearance area of ZT mesothelial monolayers 8 hours after coculture with uninduced and 20 nM 4-OHT– or 1 μg/ml doxycycline-induced MCAS spheroids carrying control WZL-empty vector, inducible WZL-TWIST, WZL-SNAIL, control FUW-LPT2, or FUW-LPT2 ZEB1 expression vectors. >20 spheroids averaged per condition. Error bars denote SEM. *P < 0.05, Student’s t test. Scale bar: 100 μm.
Figure 3
Figure 3. Knockdown of EMT transcription factors or vimentin inhibits mesothelial clearance.
(AD) qRT-PCR measurements of mRNA levels of (A) ZEB1, (B) TWIST1, (C) ZEB2, and (D) TWIST2 in OVCA433 cells transfected with siRNA SMARTpools targeting luciferase (control), ZEB1, TWIST1, ZEB2, or TWIST2. (EH) qRT-PCR measurements of mRNA levels of EMT markers in (E) ZEB1, (F) TWIST1, (G) ZEB2, or (H) TWIST2 siRNA–treated OVCA433 cells. Measurements were normalized to RPLPO mRNA levels and expressed as fold changes compared to controls. Data are shown as the mean of 3 biological replicates for each condition. Each biological replicate was derived from an average of 3 technical replicates. (I, L, and R) Western blot analysis of E-cadherin and vimentin in OVCA433 cells transfected with (I) siRNA SMARTpools targeting luciferase, TWIST1, or ZEB1; (L) with empty vector control or shRNAs targeting ZEB1; and (R) with siRNA SMARTpools targeting luciferase or vimentin. (J, Q, and S) Normalized average clearance area of ZT mesothelial monolayers at 8 hours after coincubation with OVCA433 spheroids transfected with (J) luciferase, TWIST1, TWIST2, ZEB1, or ZEB2 siRNA SMARTpools; (Q) empty vector control or shRNAs targeting ZEB1; and (S) siRNA SMARTpools targeting luciferase or vimentin. >60 positions scored per condition in 3 independent experiments. (K) qRT-PCR measurements of mRNA levels of ZEB1 in OVCA433 cells transfected with empty vector control (LKO) or shRNAs targeting ZEB1. (MP) qRT-PCR measurements of mRNA levels of EMT markers in OVCA433 cells transfected with ZEB1 (M) shRNA 1, (N) shRNA 2, (O) shRNA 4, or (P) shRNA 5 normalized to control marker expression. Error bars denote SEM. *P < 0.05, Student’s t test.
Figure 4
Figure 4. Spheroids from primary ovarian cancer cell lines display differential clearance ability that correlates with epithelial and mesenchymal marker expression.
(A) Schematic outlining the treatment of the DF primary cell populations. (B) Representative images of immunofluorescence for PAX8 (red) and DAPI (blue) in DF164, DF143, and DF163 spheroids invading GFP-expressing (green) mesothelial monolayers for 8 hours. (C) Normalized clearance area was measured in 21 primary ovarian cancer cell populations. Samples with an average normalized clearance area >1 were characterized as clearance competent. Samples with an average normalized clearance area <1 were characterized as clearance incompetent. >20 spheroids were analyzed per condition. (D) Western blot analysis of E-cadherin and vimentin expression in 21 primary ovarian cancer cell lines. (E and F) Average (E) E-cadherin or (F) vimentin protein expression levels in clearance-competent and clearance-incompetent cell lines measured by densitometry. (G) Immunohistochemical analysis of sections from paraffin-embedded blocks of cells from the original ascitic fluid that the DF cell populations were derived from. Sections were stained with antibodies directed against E-cadherin or vimentin. Representative images from sections from clearance-incompetent (DF147 and DF176) and clearance-competent (DF164) primary cells. The E-cadherin and vimentin images from DF147 and DF164 were from the same area of the tumor; however, the tumor cells in the DF176 tumors were so discohesive that it was not feasible to find the same cells in both sections. All of the cell blocks were stained with PAX8 to confirm the Müllerian identity of the tumor cells (data not shown). Error bars denote SEM. *P < 0.05, Student’s t test. Scale bar: 100 μm.
Figure 5
Figure 5. RPPA analysis reveals distinct populations of cells within some primary ovarian cancer cell lines.
(A) RPPA analysis of the DF ovarian tumor cell populations. Antibodies that distinguish clearance-competent (normalized clearance area >2.5) and clearance-incompetent lines (normalized clearance area <1.0) are shown (P < 0.05, Student’s t test). (B) RPPA analysis of 4 clearance-competent and 2 clearance-incompetent ovarian cancer cell lines. Antibodies were chosen based on analysis in A. NA, population of cells that did not attach to the tissue culture dish 48 hours after thawing; A, population of cells that attached to the tissue culture dish 48 hours after thawing; AS, population of cells that attached to the tissue culture dish 48 hours after thawing followed by 24 hours of incubation in suspension in poly-HEMA–coated culture dishes. (C) Immunohistochemical analysis of sections from the primary tumor DF155, which were stained with antibodies directed against E-cadherin or vimentin. Scale bar: 100 μm.
Figure 6
Figure 6. Mesenchymal gene signature in ovarian cancer data sets.
(A) Samples in the Tothill ovarian data set (39) that significantly express the EMT signature in Figure 1 (Spearman’s rho ≥ 0.295, P < 0.05). (B) Probability of 5-year survival and 5-year relapse-free survival in EMT signature overlapping (red) versus nonoverlapping (black) Tothill samples.

Similar articles

Cited by

References

    1. Siegel R, Naishadham D, Jemal A. Cancer statistics, 2012. CA Cancer J Clin. 2012;62(1):10–29. doi: 10.3322/caac.20138. - DOI - PubMed
    1. Cannistra SA. Cancer of the ovary. N Engl J Med. 2004;351(24):2519–2529. doi: 10.1056/NEJMra041842. - DOI - PubMed
    1. Shield K, Ackland ML, Ahmed N, Rice GE. Multicellular spheroids in ovarian cancer metastases: biology and pathology. Gynecol Oncol. 2009;113(1):143–148. doi: 10.1016/j.ygyno.2008.11.032. - DOI - PubMed
    1. Naora H, Montell DJ. Ovarian cancer metastasis: integrating insights from disparate model organisms. Nat Rev Cancer. 2005;5(5):355–366. doi: 10.1038/nrc1611. - DOI - PubMed
    1. Sehouli J, et al. Intra-abdominal tumor dissemination pattern and surgical outcome in 214 patients with primary ovarian cancer. J Surg Oncol. 2009;99(7):424–427. doi: 10.1002/jso.21288. - DOI - PubMed

Publication types

MeSH terms