Joint evolution of kin recognition and cooperation in spatially structured rhizobium populations
- PMID: 24762776
- PMCID: PMC3999197
- DOI: 10.1371/journal.pone.0095141
Joint evolution of kin recognition and cooperation in spatially structured rhizobium populations
Abstract
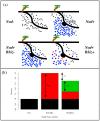
In the face of costs, cooperative interactions maintained over evolutionary time present a central question in biology. What forces maintain this cooperation? Two potential ways to explain this problem are spatially structured environments (kin selection) and kin-recognition (directed benefits). In a two-locus population genetic model, we investigated the relative roles of spatial structure and kin recognition in the maintenance of cooperation among rhizobia within the rhizobia-legume mutualism. In the case where the cooperative and kin recognition loci are independently inherited, spatial structure alone maintains cooperation, while kin recognition decreases the equilibrium frequency of cooperators. In the case of co-inheritance, spatial structure remains a stronger force, but kin recognition can transiently increase the frequency of cooperators. Our results suggest that spatial structure can be a dominant force in maintaining cooperation in rhizobium populations, providing a mechanism for maintaining the mutualistic nodulation trait. Further, our model generates unique and testable predictions that could be evaluated empirically within the legume-rhizobium mutualism.
Conflict of interest statement
Figures


Similar articles
-
Negotiation, sanctions, and context dependency in the legume-Rhizobium mutualism.Am Nat. 2011 Jul;178(1):1-14. doi: 10.1086/659997. Am Nat. 2011. PMID: 21670573
-
Evolution of nitrogen fixation in spatially structured populations of Rhizobium.Heredity (Edinb). 2000 Oct;85 Pt 4:366-72. doi: 10.1046/j.1365-2540.2000.00772.x. Heredity (Edinb). 2000. PMID: 11122414
-
A Minimal Genetic Passkey to Unlock Many Legume Doors to Root Nodulation by Rhizobia.Genes (Basel). 2020 May 7;11(5):521. doi: 10.3390/genes11050521. Genes (Basel). 2020. PMID: 32392829 Free PMC article.
-
Legumes versus rhizobia: a model for ongoing conflict in symbiosis.New Phytol. 2018 Sep;219(4):1199-1206. doi: 10.1111/nph.15222. Epub 2018 May 30. New Phytol. 2018. PMID: 29845625 Review.
-
How many peas in a pod? Legume genes responsible for mutualistic symbioses underground.Plant Cell Physiol. 2010 Sep;51(9):1381-97. doi: 10.1093/pcp/pcq107. Epub 2010 Jul 21. Plant Cell Physiol. 2010. PMID: 20660226 Free PMC article. Review.
Cited by
-
Kin Recognition in Bacteria.Annu Rev Microbiol. 2016 Sep 8;70:143-60. doi: 10.1146/annurev-micro-102215-095325. Epub 2016 Jun 17. Annu Rev Microbiol. 2016. PMID: 27359217 Free PMC article. Review.
References
-
- Hamilton WD (1964) Genetical evolution of social behaviour I. J Theor Biol 7: 1–16. - PubMed
-
- Wade MJ (1985) Soft selection, hard selection, kin selection, and group selection. Am Nat 125: 61–73.
-
- Queller DC (1992) A general model for kin selection. Evolution 46: 376–380. - PubMed
-
- Fletcher DJC, Michener CD (eds) (1989) Kin Recognition in Animals. New York: Wiley.
-
- Sherman PW, Reeve HK, Pfennig DW (1997) Recognition systems. In: Krebs, J, Davies, N, editors. Behavioural ecology. Oxford: Blackwell Scientific Publications.
Publication types
MeSH terms
Substances
Grants and funding
LinkOut - more resources
Full Text Sources
Other Literature Sources

