
Quality control and conduct of genome-wide association meta-analyses

Thomas W Winkler et al. Nat Protoc. 2014 May.

Abstract

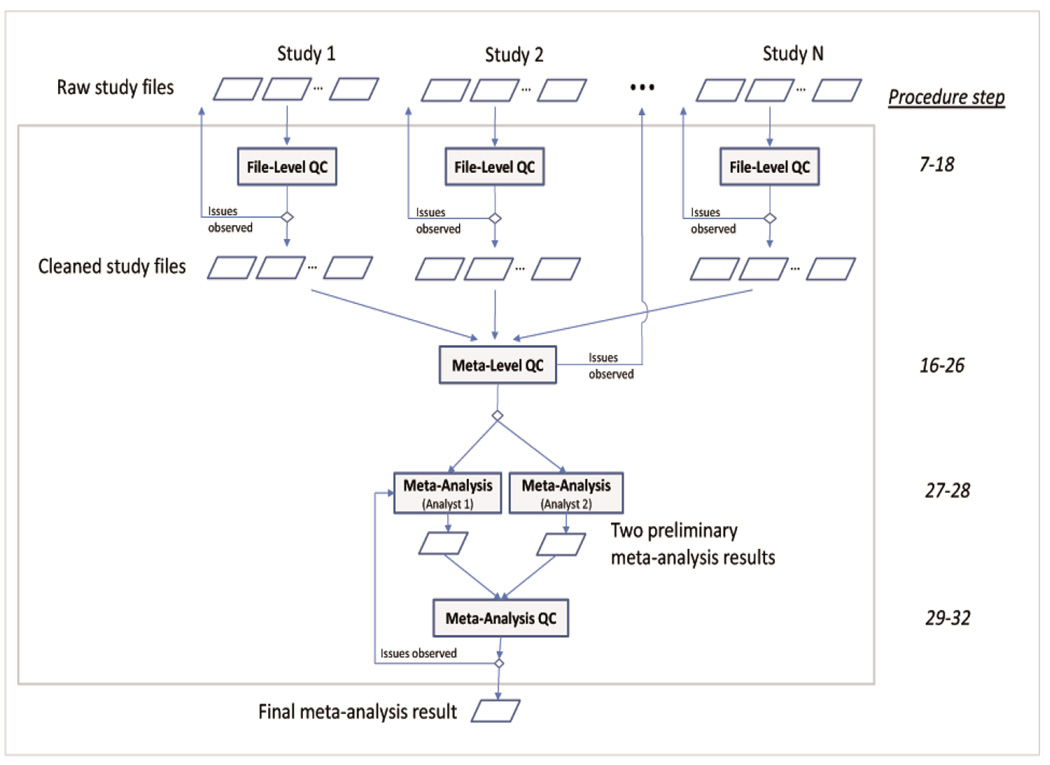
Rigorous organization and quality control (QC) are necessary to facilitate successful genome-wide association meta-analyses (GWAMAs) of statistics aggregated across multiple genome-wide association studies. This protocol provides guidelines for (i) organizational aspects of GWAMAs, and for (ii) QC at the study file level, the meta-level across studies and the meta-analysis output level. Real-world examples highlight issues experienced and solutions developed by the GIANT Consortium that has conducted meta-analyses including data from 125 studies comprising more than 330,000 individuals. We provide a general protocol for conducting GWAMAs and carrying out QC to minimize errors and to guarantee maximum use of the data. We also include details for the use of a powerful and flexible software package called EasyQC. Precise timings will be greatly influenced by consortium size. For consortia of comparable size to the GIANT Consortium, this protocol takes a minimum of about 10 months to complete.


Figures

Figure 1
Figure 1. Workflow of the QC and the meta-analysis
A typical GWAMA includes four major stages: (i) The File-level QC (Steps 7–18) includes the QC of each study file to ensure validity. This stage involves file cleaning (e.g. adjustments of column headings, file format changes, SNP exclusions based on certain criteria, or adding columns) and file checks (e.g. checking overall characteristics of the file or the number of SNP exclusions), usually in an iterative fashion. Typically this task is divided by study among analysts of the meta-analysis team. Files that pass the file-level QC are labeled as “CLEANED”. Any issues observed with particular files should be clarified with the respective study analyst directly. (ii) The Meta-level QC (Steps 19–26) addresses the comparison of file-specific statistics across files in order to depict study-specific issues yet undetected. In case issues of specific studies cannot be resolved centrally, the relevant study analyst should be contacted for clarification.. (iii) Meta-analysis (Steps 27–28) is the stage at which the meta-analysis is actually conducted, a task typically performed by two analysts independently. (iv) Meta-analysis QC (Steps 29–32) involves the checking the meta-analysis results and includes the comparison of the two meta-analyses performed by the different analysts and the quality control of the meta-analysis result.
Figure 2
Figure 2. SE-N plots to reveal issues with trait transformations
SE-N plots to detect issues with trait transformations contrasting the study-specific standard errors with sample sizes for GIANT studies typed on Metabochip and tested for association with HIPadjBMI (N=81,000): (a) before QC: a number of studies (in fact the majority of studies) revealed errors by clustering above the identity line, and (b) after QC: the same plot after having gone back to the relevant study analysts and having resolved all trait transformation issues. Different colors for the points in the plot indicate men-specific (blue), women-specific (red) or sex-combined (black) association results.
Figure 3
Figure 3. P-Z plot to reveal analytical issues with beta, standard error and P-values
Plots to reveal issues with beta estimates, standard errors and P-values for (a) an uncleaned study file showing severe deviations from the identity line and (b) the cleaned dataset showing perfect concordance. The plots compare P-values reported in the association result file to P-values calculated from Z statistics derived from the reported beta and standard error from an example GIANT file. The uncleaned study file contained a large number of highly significant but erroneous (reported) P values.
Figure 4
Figure 4. Different patterns of allele frequencies in the EAF plot
These different patterns have been observed during the QC checks performed by the GIANT analysts. In the graphs the observed (study-specific) allele frequencies reported on the y-axis are plotted against the expected (HapMap or 1000 Genomes) allele frequencies, reported on the x-axis. The plots (a)– (c) represent data from studies where allele frequencies and strand annotation are correct but participants exhibit different ancestries compared to the reference, which includes mostly samples of European ancestry: (a) study in which data are relatively consistent with the reference; (b) study in which participants had slightly different ancestry to the reference, resulting in a thicker band across the diagonal; (c) study involving participants of non-European ancestry resulting in substantial deviation from the reference. Plots (d)–(h) pertain to studies with errors in coding the effect allele, the effect allele frequency, and/or strand annotation: (d) a study in which the wrong allele was consistently labeled as effect allele; (e) a study in which a fraction of the effect alleles was mis-specified, e.g. from stating the MAF instead of the effect allele frequency, or from incorrectly assigning strand due to data management or wrong strand reference (sometimes specific to “palindromic” SNPs A/T or C/G); (f)–(h) all represent studies with other data management or analytical errors in calculating the allele frequencies.
Figure 5
Figure 5. Lambda-N plot to reveal issues with population stratification
Plot to detect issues with population stratification contrasting the study-specific λGCwith sample sizes for GIANT studies typed on Metabochip and tested for association with HIPadjBMI (N=81,000): (a) before QC: a number of studies displayed high λGC values, and (b) after QC: the same plot after having gone back to study analyst and having resolved all issues. The orange line indicates the optimal λGC=1. Dots above the red line, which visualizes the threshold λGC=1.1, represent problematic studies.

Similar articles

Cited by

References

    1. Hindorff LA, et al. Potential etiologic and functional implications of genome-wide association loci for human diseases and traits. Proceedings of the National Academy of Sciences of the United States of America. 2009;106:9362–9367. - PMC - PubMed
    1. McCarthy MI, Hirschhorn JN. Genome-wide association studies: past, present and future. Human molecular genetics. 2008;17:R100–R101. - PubMed
    1. Hirschhorn JN, Gajdos ZK. Genome-wide association studies: results from the first few years and potential implications for clinical medicine. Annual review of medicine. 2011;62:11–24. - PubMed
    1. Visscher PM, Brown MA, McCarthy MI, Yang J. Five years of GWAS discovery. American journal of human genetics. 2012;90:7–24. - PMC - PubMed
    1. Anderson CA, et al. Data quality control in genetic case-control association studies. Nature protocols. 2010;5:1564–1573. - PMC - PubMed

Publication types