Metabolomic analysis of pressure-overloaded and infarcted mouse hearts
- PMID: 24762972
- PMCID: PMC4102656
- DOI: 10.1161/CIRCHEARTFAILURE.114.001151
Metabolomic analysis of pressure-overloaded and infarcted mouse hearts
Abstract
Background: Cardiac hypertrophy and heart failure are associated with metabolic dysregulation and a state of chronic energy deficiency. Although several disparate changes in individual metabolic pathways have been described, there has been no global assessment of metabolomic changes in hypertrophic and failing hearts in vivo. Hence, we investigated the impact of pressure overload and infarction on myocardial metabolism.
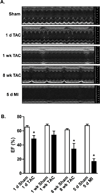
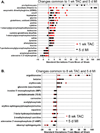
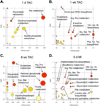
Methods and results: Male C57BL/6J mice were subjected to transverse aortic constriction or permanent coronary occlusion (myocardial infarction [MI]). A combination of LC/MS/MS and GC/MS techniques was used to measure 288 metabolites in these hearts. Both transverse aortic constriction and MI were associated with profound changes in myocardial metabolism affecting up to 40% of all metabolites measured. Prominent changes in branched-chain amino acids were observed after 1 week of transverse aortic constriction and 5 days after MI. Changes in branched-chain amino acids after MI were associated with myocardial insulin resistance. Longer duration of transverse aortic constriction and MI led to a decrease in purines, acylcarnitines, fatty acids, and several lysolipid and sphingolipid species but a marked increase in pyrimidines as well as ascorbate, heme, and other indices of oxidative stress. Cardiac remodeling and contractile dysfunction in hypertrophied hearts were associated with large increases in myocardial, but not plasma, levels of the polyamines putrescine and spermidine as well as the collagen breakdown product prolylhydroxyproline.
Conclusions: These findings reveal extensive metabolic remodeling common to both hypertrophic and failing hearts that are indicative of extracellular matrix remodeling, insulin resistance and perturbations in amino acid, and lipid and nucleotide metabolism.
Keywords: amino acids; glycolysis; heart failure; hypertrophy; metabolomics; mitochondria; oxidative stress.
© 2014 American Heart Association, Inc.
Figures


References
-
- Olson RE, Schwartz WB. Myocardial metabolism in congestive heart failure. Medicine. 1951;30:21–41. - PubMed
-
- Ingwall JS, Weiss RG. Is the failing heart energy starved? On using chemical energy to support cardiac function. Circ Res. 2004;95:135–145. - PubMed
-
- Ashrafian H, Frenneaux MP, Opie LH. Metabolic mechanisms in heart failure. Circulation. 2007;116:434–448. - PubMed
-
- Stanley WC, Recchia FA, Lopaschuk GD. Myocardial substrate metabolism in the normal and failing heart. Physiol Rev. 2005;85:1093–1129. - PubMed
-
- Lopaschuk GD, Ussher JR, Folmes CD, Jaswal JS, Stanley WC. Myocardial fatty acid metabolism in health and disease. Physiol Rev. 2010;90:207–258. - PubMed
Publication types
MeSH terms
Grants and funding
- P20 RR024489/RR/NCRR NIH HHS/United States
- HL78825/HL/NHLBI NIH HHS/United States
- R01 HL094419/HL/NHLBI NIH HHS/United States
- HL83320/HL/NHLBI NIH HHS/United States
- P30 DK079637/DK/NIDDK NIH HHS/United States
- HL55477/HL/NHLBI NIH HHS/United States
- HL59378/HL/NHLBI NIH HHS/United States
- HL94419/HL/NHLBI NIH HHS/United States
- R01 HL055477/HL/NHLBI NIH HHS/United States
- GM103492/GM/NIGMS NIH HHS/United States
- R01 HL059378/HL/NHLBI NIH HHS/United States
- R01 HL083320/HL/NHLBI NIH HHS/United States
- P20 GM103492/GM/NIGMS NIH HHS/United States
- P01 HL078825/HL/NHLBI NIH HHS/United States
LinkOut - more resources
Full Text Sources
Other Literature Sources
Medical
Miscellaneous

