. 2014 Jul;9(7):998-1006.
doi: 10.4161/epi.28945. Epub 2014 Apr 24.

Epigenome-wide association study reveals longitudinally stable DNA methylation differences in CD4+ T cells from children with IgE-mediated food allergy

Affiliations

Epigenome-wide association study reveals longitudinally stable DNA methylation differences in CD4+ T cells from children with IgE-mediated food allergy

David Martino et al. Epigenetics. 2014 Jul.

Erratum in

  • Corrigendum.
    [No authors listed] [No authors listed] Epigenetics. 2015;10(10):994. doi: 10.1080/15592294.2015.1078144. Epigenetics. 2015. PMID: 26453355 Free PMC article. No abstract available.

Abstract

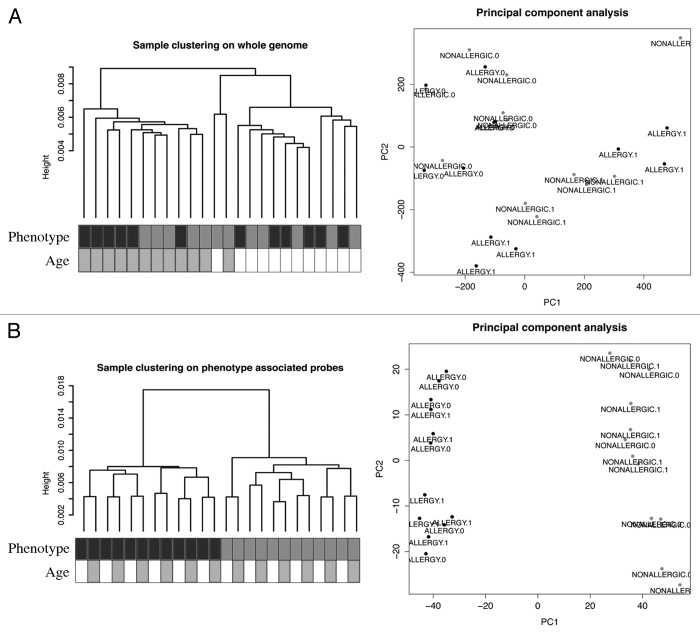
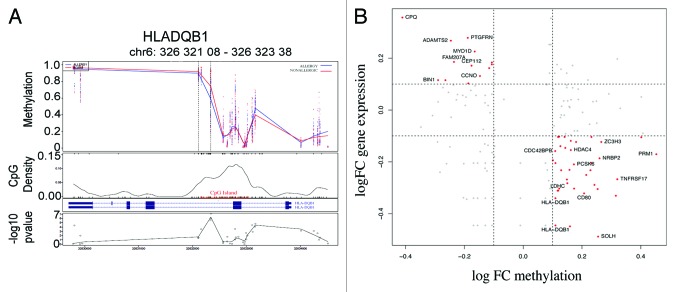
Food allergy is mediated by a combination of genetic and environmental risk factors, potentially mediated by epigenetic mechanisms. CD4+ T-cells are key drivers of the allergic response, and may therefore harbor epigenetic variation in association with the disease phenotype. Here we retrospectively examined genome-wide DNA methylation profiles (~450,000 CpGs) from CD4+ T-cells on a birth cohort of 12 children with IgE-mediated food allergy diagnosed at 12-months, and 12 non-allergic controls. DNA samples were available at two time points, birth and 12-months.

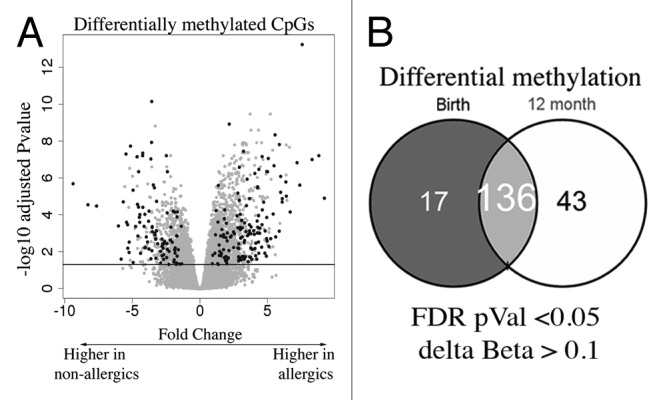
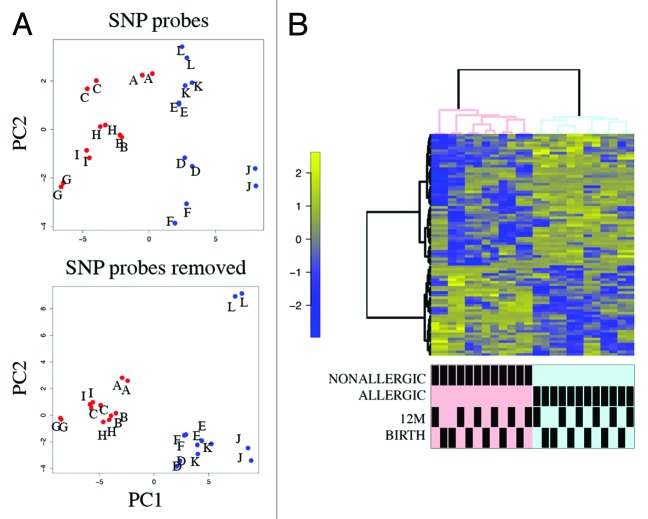
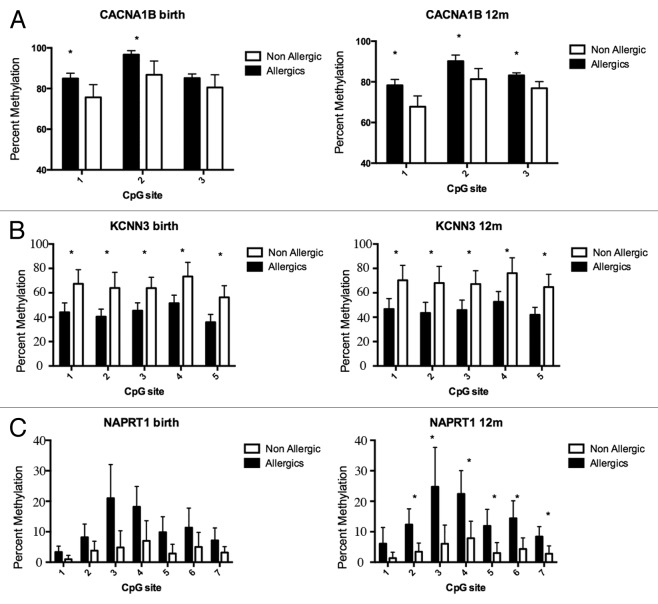
Case: control comparisons of CD4+ methylation profiles identified 179 differentially methylated probes (DMP) at 12-months and 136 DMP at birth (FDR-adjusted P value<0.05, delta β>0.1). Approximately 30% of DMPs were coincident with previously annotated SNPs. A total of 92 [corrected] allergy-associated non-SNP DMPs were present at birth when individuals were initially disease-free, potentially implicating these loci in the causal pathway. Pathway analysis of differentially methylated genes identified several MAP kinase signaling molecules. Mass spectrometry was used to validate 15 CpG sites at 3 candidate genes. Combined analysis of differential methylation with gene expression profiles revealed gene expression differences at some but not all allergy associated differentially methylated genes. Thus, dysregulation of DNA methylation at MAPK signaling-associated genes during early CD4+ T-cell development may contribute to suboptimal T-lymphocyte responses in early childhood associated with the development of food allergy.

Keywords: EWAS; Infinium 450k; allergic disease; food allergy; in utero programming; metastable epialleles.


Figures

None
Figure 1. A subset of DNA methylation profiles of CD4+ cells distinguishes food allergy cases from controls. (A) Unsupervised hierarchical clustering of whole genome methylation data derived from ex vivo isolated CD4+ cells of food allergy cases (n = 12, labeled black) and non-allergic controls (n = 12, labeled gray) (left panel). Sample annotation is indicated by shaded boxes below the dendrogram. MDS analysis of the same methylation data fails to discriminate samples based on disease-status (right panel). (B) Unsupervised clustering of the same DNA methylation data based on phenotype-associated probes identified by ANOVA distinguishes disease-phenotypes (left panel). MDS analysis based on the filtered data successfully discriminates food allergy cases and controls. ALLERGY.1 = allergic 12 min, ALLERGY.0 = allergic birth.
None
Figure 2. EWAS analysis test identifies differentially methylated CpG (A) Volcano plot depiction of the case vs. control test for differential methylation. DMP were identified by a combination of significance and effect size. The plot shows the log fold genome-wide methylation measurements (x-axis) by the –log P value (FDR-adjusted). Significant data points lie above the gray line. Those with an absolute delta Beta effect size of >10% are shown in black and were identified as candidates. (B) Venn diagram of DMPs detected at each age.
None
Figure 3. Principal component analysis (PCA) and heatmap visualization of metastable DMPs (A) PCA of SNP-associated (top panel) vs. non SNP-associated metastable DMP. The between-sample variance relative to the between-class variance is higher for SNP-associated probes. Pooled samples are labeled alphabetically. Cases are shown in red, controls in blue. (B) Cluster heatmap analysis of 92 non-SNP metastable DMP. Rows represent probes and columns represent samples. Cells are colored according to level of methylation (Blue = low methylation, yellow = high methylation, scale denotes row standard deviations). Sample annotation is indicated below the dendrogram.
None
Figure 4. DNA methylation levels measured by Sequenom EpiTyper validate BeadArray methylation data. Target validation for 3 different genes, (A) CACNA1B a calcium signaling molecule (B) KCNN3 a calcium activated channel molecule (C) NAPRT1, an oxidative stress gene. Bars show average percent methylation with standard deviation. Statistical analysis performed by Man-Whitney U test corrected for multiple testing (q-value 1%).
None
Figure 5. Differential methylation at HLA-DQB1 and scatterplot of relationship between methylation and gene expression. (A) The figure shows group average methylation data mapped to genomic region for HLADQB1 gene. The top panel shows 12-mo methylation measurements from allergics (blue) and non-allergics (red) plotted against genomic location. The dashed lines indicate the differentially methylated region and the gene transcript is show below. The location of a CpG island is indicated in red and the –log P values for each data point are shown in the bottom panel. (B) Scatterplot of log fold change (FC) DNA methylation (case v control) and gene expression (case vs. control).

Similar articles

Cited by

References

    1. Osborne NJ, Koplin JJ, Martin PE, Gurrin LC, Lowe AJ, Matheson MC, Ponsonby A-L, Wake M, Tang MLK, Dharmage SC, et al. HealthNuts Investigators Prevalence of challenge-proven IgE-mediated food allergy using population-based sampling and predetermined challenge criteria in infants. J Allergy Clin Immunol. 2011;127:668–, e1-2. doi: 10.1016/j.jaci.2011.01.039. - DOI - PubMed
    1. Prescott S, Allen KJ. Food allergy: riding the second wave of the allergy epidemic. Pediatr Allergy Immunol. 2011;22:155–60. doi: 10.1111/j.1399-3038.2011.01145.x. - DOI - PubMed
    1. Morgan DK, Whitelaw E. The case for transgenerational epigenetic inheritance in humans. Mamm Genome. 2008;19:394–7. doi: 10.1007/s00335-008-9124-y. - DOI - PubMed
    1. Trowbridge JJ, Snow JW, Kim J, Orkin SH. DNA methyltransferase 1 is essential for and uniquely regulates hematopoietic stem and progenitor cells. Cell Stem Cell. 2009;5:442–9. doi: 10.1016/j.stem.2009.08.016. - DOI - PMC - PubMed
    1. Martino D, Maksimovic J, Joo J-H, Prescott SL, Saffery R. Genome-scale profiling reveals a subset of genes regulated by DNA methylation that program somatic T-cell phenotypes in humans. Genes Immun. 2012;13:388–98. doi: 10.1038/gene.2012.7. - DOI - PubMed

Publication types

MeSH terms

Substances