A systematic comparison of supervised classifiers
- PMID: 24763312
- PMCID: PMC3998948
- DOI: 10.1371/journal.pone.0094137
A systematic comparison of supervised classifiers
Abstract
Pattern recognition has been employed in a myriad of industrial, commercial and academic applications. Many techniques have been devised to tackle such a diversity of applications. Despite the long tradition of pattern recognition research, there is no technique that yields the best classification in all scenarios. Therefore, as many techniques as possible should be considered in high accuracy applications. Typical related works either focus on the performance of a given algorithm or compare various classification methods. In many occasions, however, researchers who are not experts in the field of machine learning have to deal with practical classification tasks without an in-depth knowledge about the underlying parameters. Actually, the adequate choice of classifiers and parameters in such practical circumstances constitutes a long-standing problem and is one of the subjects of the current paper. We carried out a performance study of nine well-known classifiers implemented in the Weka framework and compared the influence of the parameter configurations on the accuracy. The default configuration of parameters in Weka was found to provide near optimal performance for most cases, not including methods such as the support vector machine (SVM). In addition, the k-nearest neighbor method frequently allowed the best accuracy. In certain conditions, it was possible to improve the quality of SVM by more than 20% with respect to their default parameter configuration.
Conflict of interest statement
Figures

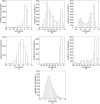
 , (b)
, (b)  and (c)
  .
.

 of the kNN classifier. Panel (a) illustrates the default value of the parameter (
 ) with a red vertical dashed line. The accuracy rate associated with default values of parameters is denoted by
  and the best accuracy rate observed in the neighborhood of the default value of
  is represented as
  . The difference between these two quantities is represented by
  . Panel (b) shows how the accuracy rates vary with the variation of
  in DB2F (each line represent the behavior of a particular dataset in DB2F). Finally, panel (c) displays the distribution of
  in DB2F.

References
-
- Mayer-Schonberger V, Cukier K (2013) Big Data: a revolution that will transform how we live, work, and think. Eamon Dolan/Houghton Mifflin Harcourt.
-
- Sathi A (2013) Big Data analytics: disruptive technologies for changing the game. Mc Press.
-
- Montavon G, Rupp M, Gobre V, Vazquez-Mayagoitia A, Hansen K, Tkatchenko A, Mller K-R, Lilienfeld OA (2013) Machine learning of molecular electronic properties in chemical compound space. New Journal of Physics 15: 095003.
Publication types
MeSH terms
LinkOut - more resources
Full Text Sources
Other Literature Sources

