Guideline
. 2014 Jul;16(4):658-73.
doi: 10.1208/s12248-014-9599-2. Epub 2014 Apr 24.

Assessment and reporting of the clinical immunogenicity of therapeutic proteins and peptides-harmonized terminology and tactical recommendations

Affiliations
Guideline

Assessment and reporting of the clinical immunogenicity of therapeutic proteins and peptides-harmonized terminology and tactical recommendations

G Shankar et al. AAPS J. 2014 Jul.

Abstract

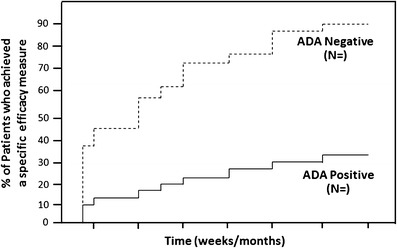
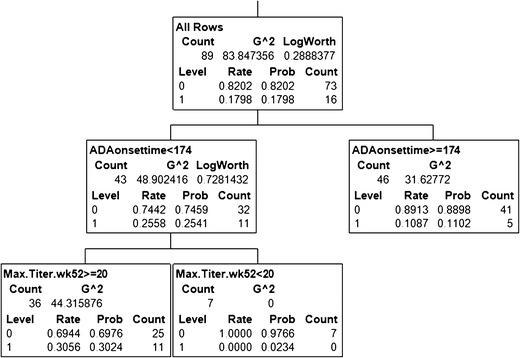
Immunogenicity is a significant concern for biologic drugs as it can affect both safety and efficacy. To date, the descriptions of product immunogenicity have varied not only due to different degrees of understanding of product immunogenicity at the time of licensing but also due to an evolving lexicon that has generated some confusion in the field. In recent years, there has been growing consensus regarding the data needed to assess product immunogenicity. Harmonization of the strategy for the elucidation of product immunogenicity by drug developers, as well as the use of defined common terminology, can benefit medical practitioners, health regulatory agencies, and ultimately the patients. Clearly, understanding the incidence, kinetics and magnitude of anti-drug antibody (ADA), its neutralizing ability, cross-reactivity with endogenous molecules or other marketed biologic drugs, and related clinical impact may enhance clinical management of patients treated with biologic drugs. To that end, the authors present terms and definitions for describing and analyzing clinical immunogenicity data and suggest approaches to data presentation, emphasizing associations of ADA development with pharmacokinetics, efficacy, and safety that are necessary to assess the clinical relevance of immunogenicity.


Figures

Fig. 1
Fig. 1
Treatment-induced ADA kinetics: onset and duration. A plot of the duration of ADA-positive results versus the ADA onset time, with vertical and horizontal grid lines drawn at the quartiles of the distributions. This helps to determine whether the persistent or transient nature of the ADA is related to the time when the ADA levels are observed in the patients. For a clear assessment, only those patients for whom the ADA onset time is at least 16 weeks before the last visit or those that were ADA-negative at or before the last visit should be included in this graph. When interpreting this graph, it should be kept in mind that the maximal duration at later onset times will be proportionately less. Symbols in the plot could indicate a variable of choice (dosage in this example), clinical impact such as effects on efficacy (e.g., yes, no, and study discontinuation), adverse reactions (e.g., yes, no, and study discontinuation), etc.
Fig. 2
Fig. 2
Treatment-induced ADA incidence kinetics: The development of transient and persistent ADA immune responses in an example study is illustrated. Each point indicates the percentage of biologic drug-treated patients who developed ADA at indicated onset times and whose duration may have been transient or persistent. In this example, 10 % of treated subjects had a 2-month ADA development time, with 4 % having a transient ADA response and 6 % having a persistent ADA response. Likewise, 6 % of treated subjects had a 6-month ADA development time, with 0.5 % having a transient ADA response and 5.5 % having a persistent ADA response. Data can be plotted by dosage
Fig. 3
Fig. 3
ADA titer kinetics. This plot of titers over time in a study is useful in determining whether the ADA levels tend to change over time during the treatment. Each box plot represents the titer range, Q1, Median (Q2), Q3, excluding outliers (asterisks)
Fig. 4
Fig. 4
a Influence of ADA on PK (trough serum concentrations). This plot of serum concentrations of the biologic drug in ADA-positive subjects (closed symbols) and ADA-negative subjects (open symbols) over time provides a useful visual assessment of the effect of ADA on circulating drug levels. The ADA status (positive or negative) is considered in a cumulative manner at each time point (i.e., if a subject had a positive sample at any prior time before an efficacy assessment visit and that subject would be counted as positive through that time point). If differences are not easily apparent between the ADA-positive and ADA-negative subjects, it can be informative to present the ADA-positive subjects in groups of titers (quartiles) versus the ADA-negative subjects. Alternatively, if a clinically relevant threshold of ADA titer was already known, serum concentration values from ADA-positive patients with titers above the threshold, those below the threshold, and ADA-negative patients can each be plotted. At each time point, the geometric mean drug concentration and 90 or 95% confidence intervals are shown. Additional plots may be added for each dose level. When ADA-inconclusive subjects comprise a significant proportion, it should also be included in this plot. Similarly, such a graphical plot may be useful to illustrate the effect of transient versus persistent immune responses on serum concentrations of drug. b Influence of ADA PK (clearance rate). This plot of apparent clearance rate (CL/F) of the biologic drug in ADA-positive subjects (closed symbols) and ADA-negative subjects (open symbols) provides a useful visual assessment of the effect of ADA on drug elimination. The ADA status (positive or negative) is considered in a cumulative manner at each time point (i.e., if a subject had a positive sample at any prior time before an efficacy assessment visit and that subject would be counted as positive through that time point). If differences are not easily apparent between the ADA-positive and ADA-negative subjects, it can be informative to present the ADA-positive subjects in groups of titers (quartiles) versus the ADA-negative subjects. Alternatively, if a clinically relevant threshold of an ADA attribute was already known, drug clearance values from ADA-positive patients with results above the threshold, those below the threshold, and ADA-negative patients can each be plotted. When ADA-inconclusive subjects comprise a significant proportion, it should also be included in this plot. Similarly, such a graphical plot may be useful to illustrate the effect of transient versus persistent immune responses on clearance rate. Alternative visualizations as box-plots with individual points overlaid may also be used. Data may also be grouped by dosing period, demographics, etc.
Fig. 5
Fig. 5
Influence of ADA on clinical efficacy. This plot of an efficacy measure in ADA-positive subjects and ADA-negative subjects over time provides a useful visual assessment of the effect of ADA on drug efficacy. The ADA status (positive or negative) is considered in a cumulative manner at each time point (i.e., if a subject had a positive sample at any prior time before an efficacy assessment visit then that subject would be counted as positive through that time point). If differences are not easily apparent between the ADA-positive and ADA-negative subjects, it can be informative to present the ADA-positive subjects in groups of titers (quartiles) versus the ADA-negative subjects. Similarly, such a graphical plot may be useful to illustrate the effect of transient versus persistent immune responses on efficacy. Alternatively, if a clinically relevant threshold of an ADA attribute was already known, efficacy data from ADA-positive patients with results above the threshold, those below the threshold, and ADA-negative patients can each be plotted. Sample sizes are indicated
Fig. 6
Fig. 6
An example CART model for the association to safety (adverse event) incidence. Among the 89 patients found to be ADA-positive through 2 years of treatment, ∼18% had a specific type of adverse event (AE). The association of this binary safety endpoint (1 = yes AE; 0 = no AE) with the ADA attributes titer, onset, and duration was evaluated. The model picked ADA onset time as the most important predictor; 26% of the 43 patients with onset time before 174 days had the AE, whereas only 11% of the 46 patients with later onset time had AE. Among 43 patients with ADA onset earlier than 174 days, the model found titer levels to be a useful predictor; 31% of the 36 patients with titer level >20 had the AE, where none of the seven patients that had titer levels <20 had any AE. Using this model, it could be inferred that biologic drug-treated patients were 2.4-fold more likely to develop ADA in the initial 25-week period than later. Furthermore, at least among those who developed ADA in the initial 25 weeks, titers less than 20 were not associated with the AE

References

    1. Schellekens H. Bioequivalence and the immunogenicity of biopharmaceuticals. Nat Rev Drug Discov. 2002;1(6):457–462. doi: 10.1038/nrd818. - DOI - PubMed
    1. Schnabel CA, Fineberg SE, Kim DD. Immunogenicity of xenopeptide hormone therapies. Peptides. 2006;27(7):1902–1910. doi: 10.1016/j.peptides.2006.01.019. - DOI - PubMed
    1. Kuus-Reichel K, Grauer LS, Karavodin LM, Knott C, Krusemeier M, Kay NE. Will immunogenicity limit the use, efficacy, and future development of therapeutic monoclonal antibodies? Clin Diagn Lab Immunol. 1994;1(4):365–372. - PMC - PubMed
    1. Koren E, Zuckerman LA, Mire-Sluis AR. Immune responses to therapeutic proteins in humans—clinical significance, assessment and prediction. Curr Pharm Biotechnol. 2002;3(4):349–360. doi: 10.2174/1389201023378175. - DOI - PubMed
    1. Schellekens H, Casadevall N. Immunogenicity of recombinant human proteins: causes and consequences. J Neurol. 2004;251(Suppl 2):II4–II9. - PubMed

Publication types