. 2014 Apr;2(4):361-70.
doi: 10.1158/2326-6066.CIR-13-0127. Epub 2014 Jan 10.

PD-L1 expression in triple-negative breast cancer

Affiliations

PD-L1 expression in triple-negative breast cancer

Elizabeth A Mittendorf et al. Cancer Immunol Res. 2014 Apr.

Abstract

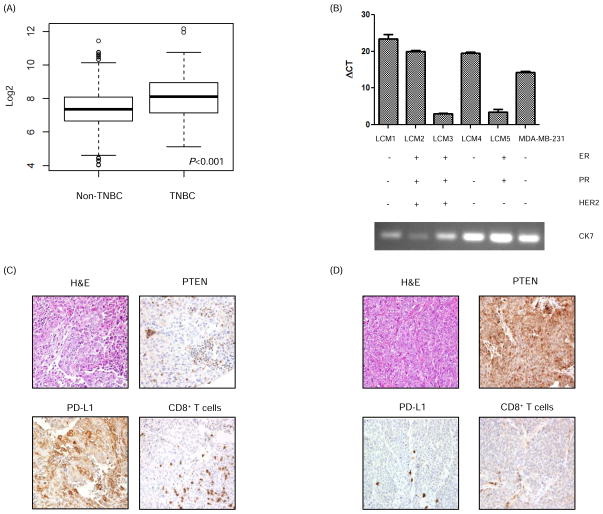
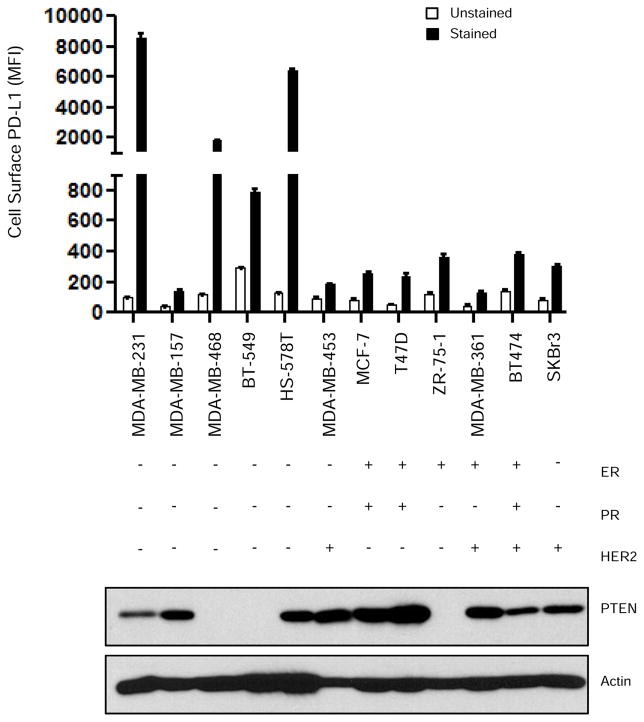
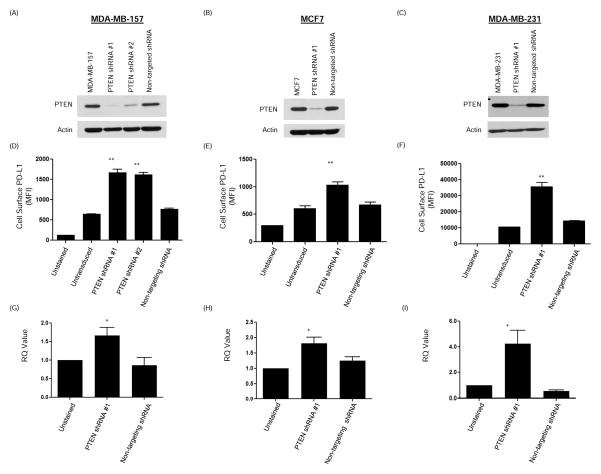
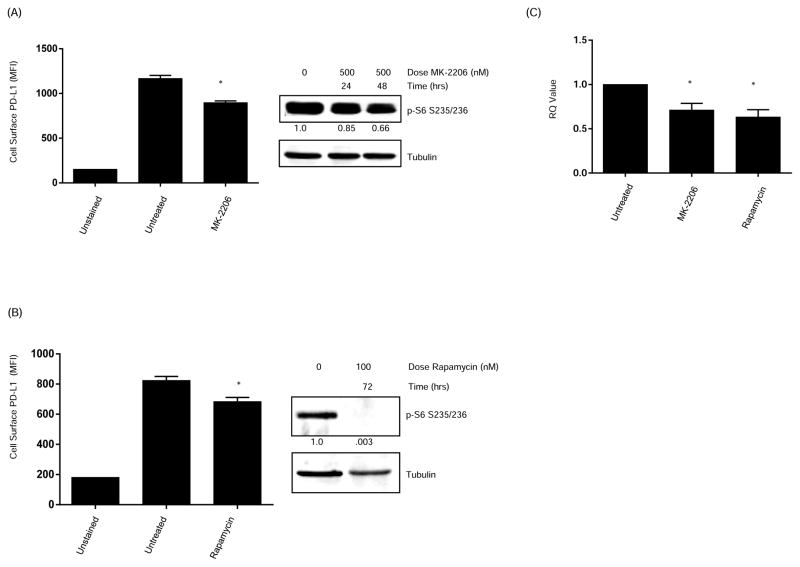
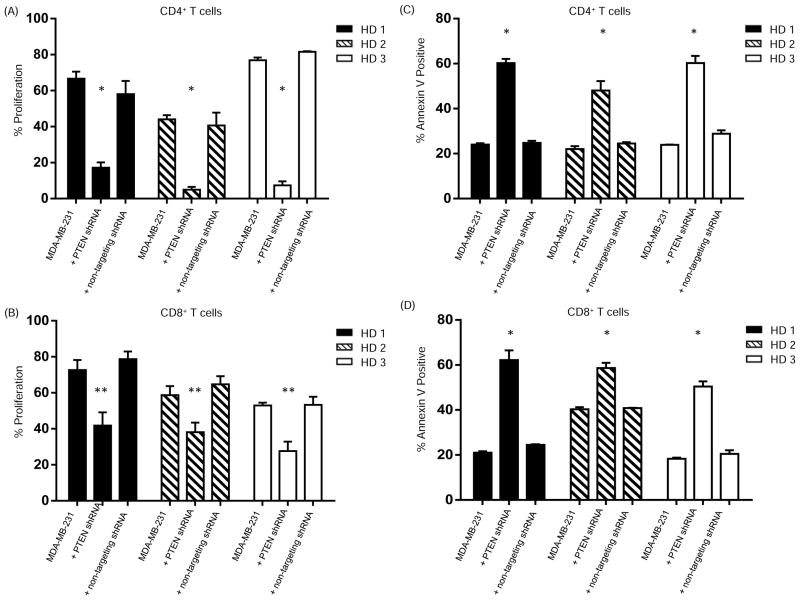
Early-phase trials targeting the T-cell inhibitory molecule programmed cell death ligand 1 (PD-L1) have shown clinical efficacy in cancer. This study was undertaken to determine whether PD-L1 is overexpressed in triple-negative breast cancer (TNBC) and to investigate the loss of PTEN as a mechanism of PD-L1 regulation. The Cancer Genome Atlas (TCGA) RNA sequencing data showed significantly greater expression of the PD-L1 gene in TNBC (n = 120) compared with non-TNBC (n = 716; P < 0.001). Breast tumor tissue microarrays were evaluated for PD-L1 expression, which was present in 19% (20 of 105) of TNBC specimens. PD-L1(+) tumors had greater CD8(+) T-cell infiltrate than PD-L1(-) tumors (688 cells/mm vs. 263 cells/mm; P < 0.0001). To determine the effect of PTEN loss on PD-L1 expression, stable cell lines were generated using PTEN short hairpin RNA (shRNA). PTEN knockdown led to significantly higher cell-surface PD-L1 expression and PD-L1 transcripts, suggesting transcriptional regulation. Moreover, phosphoinositide 3-kinase (PI3K) pathway inhibition using the AKT inhibitor MK-2206 or rapamycin resulted in decreased PD-L1 expression, further linking PTEN and PI3K signaling to PD-L1 regulation. Coculture experiments were performed to determine the functional effect of altered PD-L1 expression. Increased PD-L1 cell surface expression by tumor cells induced by PTEN loss led to decreased T-cell proliferation and increased apoptosis. PD-L1 is expressed in 20% of TNBCs, suggesting PD-L1 as a therapeutic target in TNBCs. Because PTEN loss is one mechanism regulating PD-L1 expression, agents targeting the PI3K pathway may increase the antitumor adaptive immune responses.


Conflict of interest statement

Conflict of Interest: The authors declare no conflict of interest.

Disclosure of Potential Conflicts of Interest

The authors report no potential conflicts of interest.

Figures

Figure 1
Figure 1. PD-L1 is expressed in breast cancer
(A) Analysis of The Cancer Genome Atlas data demonstrated higher PD-L1 mRNA expression in breast tissue specimens from patients with TNBC (n=120) in contrast to patients with non-TNBC (n=716). Data are mean ± SD of PD-L1 mRNA expression. Analysis was done using a t test. Log2 expression of PD-L1 is shown on the y-axis. (B) PD-L1 mRNA expression (mean ± SD) in breast cancer patient tumors was measured using RT-PCR. RNA was extracted from breast cancer cells that were isolated from tumors using laser capture microdissection (LCM 1–5). Cytokeratin 7 (CK7) was used as a marker of breast cancer to confirm the source of the extracted RNA. MDA-MB-231 was used as a positive control for PD-L1. (C) Representative TNBC patient tumor tissues showing loss of PTEN expression and high PD-L1 expression in tumor cells, and a significant CD8+ T cell infiltrate in contrast with another TNBC patient tissue (D) which shows high PTEN expression in breast tumor cells, no PD-L1 expression in tumor cells, minimal PD-L1 expression in associated inflammatory cells, and minimal intratumoral CD8+ T cell infiltrate. Magnification = 100x.
Figure 2
Figure 2. PD-L1 and PTEN expression in cultured breast cancer cell lines
A panel of breast cancer cell lines was evaluated for cell-surface PD-L1 expression by flow cytometry (MFI mean ± SD) and for PTEN expression by western blot analysis. Actin was used as a loading control. Data shows higher PD-L1 expression in four of the five TNBC cell lines evaluated in comparison with non-TNBC cell lines. MFI, median fluorescence intensity; ER, estrogen receptor; PR, progesterone receptor; PTEN, phosphatase and tensin homolog
Figure 3
Figure 3. PTEN downregulation increases PD-L1 cell surface expression
MDA-MB-157, MCF7 and MDA-MB-231 breast cancer cell lines were transduced with PTEN shRNA lentiviral transduction particles. (A–C) Western blot analysis performed on lysates obtained from these cells confirmed decreased PTEN expression. Non-targeting lentiviral transduction particles were used as a control. Actin was used to show equal loading. (D–F) Cell surface PD-L1 expression was evaluated by flow cytometry staining and PD-L1 MFI (mean ± SD) demonstrated a significant increase in PD-L1 expression on cells, correlating with a decrease in PTEN expression. Decreased PTEN expression in MDA-MB-231 cell line, which has the highest baseline cell surface expression of PD-L1, resulted in a significant further increase in PD-L1 expression. (G–I) RNA was extracted from MDA-MB-157, MCF7 and MDA-MB-231 cells that were transduced with PTEN or non-targeting shRNA. Mean ± SD RQ values obtained from qRT-PCR demonstrated a significant increase in the PD-L1 transcript that coincided with decreased PTEN expression. All assays were performed in triplicate. ANOVA test was performed using Prism 5.0 software (*P<0.05); (**P<0.0001) MFI = median fluorescence intensity.
Figure 4
Figure 4. Inhibition of the Phosphatidylinositol 3-kinase pathway increases PD-L1 expression
(A) MDA-MB-468 breast cancer cells were treated for 48 hours with the AKT inhibitor MK-2206 (500 nM) followed by PD-L1 cell surface expression assessed by flow cytometry. (B) MDA-MB-468 breast cancer cells were treated with the mTOR inhibitor rapamycin (100 nM). After 72 hours, cells were harvested and PD-L1 cell surface expression was assessed by flow cytometry. The addition of the PI3K pathway inhibitors significantly decreased the levels of surface PD-L1 expression. Data represent PD-L1 MFI (mean ± SD). Western blot showing decreased expression of p-S6 confirmed pathway inhibition by MK-2206 and rapamycin. (C) RNA was extracted from additional MDA-MB-468 breast cancer cells treated with MK-2206 or rapamycin. qRT-PCR showed a decrease in PD-L1 mRNA expression after addition of AKT and mTOR inhibitors. Data shown is representative of three separate experiments. All experiments were performed in triplicate. Data represent RQ value (mean ± SD). ANOVA test was performed using Prism 5.0 software (*P<0.01). MFI, median fluorescence intensity.
Figure 5
Figure 5. Increased PD-L1 cell surface expression following PTEN knockdown inhibits T cell proliferation and increases apoptosis
To determine the effect of the increased PD-L1 cell surface expression following PTEN knockdown on T cell proliferation, CD4+ (A) or CD8+ (B) T cells were isolated from peripheral blood mononuclear cells (PBMC) from healthy donors, were labeled with carboxyfluorescein succinimidyl ester (CFSE) and co-cultured with MDA-MB-231 breast cancer cells that were transduced with PTEN shRNA (i.e. increase surface PD-L1) or negative control groups including parental MDA-MB-231 cells or MDA-MB-231 cells transduced with non-targeting shRNA.. After stimulation with anti-CD3/CD28, proliferation was measured using flow cytometry. The experiment was performed three times in triplicate and the average percent proliferation ± SD for each experiment is shown. CD4+ (A) or CD8+ (B) T cells were also cultured alone (unstimulated, negative control) or stimulated with anti-CD3-CD28 in the absence of MDA-MB-231 cells (positive control). To determine the effect of increased PD-L1 cell surface expression on apoptosis, standard annexin V assays were performed. Anti-CD3/CD28-stimulated CD4+ (C) or CD8+ (D) T cells were co-cultured with breast cancer cells for 20 hours and then resuspended in Annexin binding buffer. Analysis was performed using flow cytometry. The experiment was repeated three times in triplicate and the average percent Annexin V positive CD4+ (D) and CD8+ (E) T cells ± SD for each experiment is shown. Significance was determined using an ANOVA test (**P<0.005) (*P<0.0001).

References

    1. Dent R, Trudeau M, Pritchard KI, Hanna WM, Kahn HK, Sawka CA, et al. Triple-negative breast cancer: clinical features and patterns of recurrence. Clin Cancer Res. 2007;13:4429–34. - PubMed
    1. Lehmann BD, Bauer JA, Chen X, Sanders ME, Chakravarthy AB, Shyr Y, et al. Identification of human triple-negative breast cancer subtypes and preclinical models for selection of targeted therapies. J Clin Invest. 2011;121:2750–67. - PMC - PubMed
    1. Haffty BG, Yang Q, Reiss M, Kearney T, Higgins SA, Weidhaas J, et al. Locoregional relapse and distant metastasis in conservatively managed triple negative early-stage breast cancer. J Clin Oncol. 2006;24:5652–7. - PubMed
    1. Liedtke C, Mazouni C, Hess KR, Andre F, Tordai A, Mejia JA, et al. Response to neoadjuvant therapy and long-term survival in patients with triple-negative breast cancer. J Clin Oncol. 2008;26:1275–81. - PubMed
    1. Desmedt C, Haibe-Kains B, Wirapati P, Buyse M, Larsimont D, Bontempi G, et al. Biological processes associated with breast cancer clinical outcome depend on the molecular subtypes. Clin Cancer Res. 2008;14:5158–65. - PubMed

Publication types

MeSH terms