Hepcidin expression in colon during trinitrobenzene sulfonic acid-induced colitis in rats
- PMID: 24764672
- PMCID: PMC3989970
- DOI: 10.3748/wjg.v20.i15.4345
Hepcidin expression in colon during trinitrobenzene sulfonic acid-induced colitis in rats
Abstract
Aim: To investigate hepcidin expression, interleukin-6 (IL-6) production and iron levels in the rat colon in the presence of trinitrobenzene sulfonic acid (TNBS)-induced colitis.
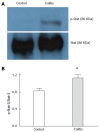
Methods: In rats, we evaluated the severity of colitis induced by repeated TNBS administration using macroscopic and microscopic scoring systems and myeloperoxidase activity measurements. The colonic levels of hepcidin, tumor necrosis factor alpha (TNF-α), IL-10 and IL-6 were measured by Enzyme-Linked Immunosorbent Assay, and hepcidin-25 expression and iron deposition were analyzed by immunohistochemistry and the Prussian blue reaction, respectively. Stat-3 phosphorylation was assessed by Western blot analysis. Hematological parameters, iron and transferrin levels, and transferrin saturation were also measured. Additionally, the ability of iron, pathogen-derived molecules and IL-6 to induce hepcidin expression in HT-29 cells was evaluated.
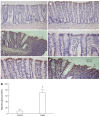
Results: Repeated TNBS administration to rats resulted in macroscopically and microscopically detectable colon lesions and elevated colonic myeloperoxidase activity. Hepcidin-25 protein levels were increased in colonic surface epithelia in colitic rats (10.2 ± 4.0 pg/mg protein vs 71.0 ± 8.4 pg/mg protein, P < 0.01). Elevated IL-6 levels (8.2 ± 1.7 pg/mg protein vs 14.7 ± 0.7 pg/mg protein, P < 0.05), TNF-α levels (1.8 ± 1.2 pg/mg protein vs 7.4 ± 2.1 pg/mg protein, P < 0.05) and Stat-3 phosphorylation were also observed. Systemic alterations in iron homeostasis, hepcidin levels and anemia were not detected in colitic rats. Iron deposition in the colon was only observed during colitis. Hepcidin gene expression was increased in HT-29 cells after IL-6 and lipopolysaccharide [a toll-like receptor 4 (TLR-4) ligand] treatment. Deferoxamine, ferric citrate and peptidoglycan (a TLR-2 ligand) were unable to alter the in vitro expression of hepcidin in HT-29 cells.
Conclusion: Colitis increased local hepcidin-25 expression, which was associated with the IL-6/Stat-3 signaling pathway. An increase in local iron sequestration was also observed, but additional studies are needed to determine whether this sequestration is a defensive or pathological response to intestinal inflammation.
Keywords: Anemia; Hepcidin-25; Interleukin-6; Iron; Stat-3; Toll-like receptor 4.
Figures


Similar articles
-
Sex steroid regulation of macrophage migration inhibitory factor in normal and inflamed colon in the female rat.Gastroenterology. 2007 Mar;132(3):982-93. doi: 10.1053/j.gastro.2006.12.028. Epub 2006 Dec 17. Gastroenterology. 2007. PMID: 17324399
-
Therapeutic effects of rectal administration of muscovite on experimental colitis in rats.J Gastroenterol Hepatol. 2009 May;24(5):912-9. doi: 10.1111/j.1440-1746.2008.05721.x. Epub 2009 Feb 9. J Gastroenterol Hepatol. 2009. PMID: 19220658
-
Total glucosides of peony attenuates 2,4,6-trinitrobenzene sulfonic acid/ethanol-induced colitis in rats through adjustment of TH1/TH2 cytokines polarization.Cell Biochem Biophys. 2014 Jan;68(1):83-95. doi: 10.1007/s12013-013-9696-3. Cell Biochem Biophys. 2014. PMID: 23771723
-
Dual role of hepcidin in response to pathogens.Microb Pathog. 2025 Jun;203:107496. doi: 10.1016/j.micpath.2025.107496. Epub 2025 Mar 19. Microb Pathog. 2025. PMID: 40118299 Review.
-
Cytokines mediating the induction of chronic colitis and colitis-associated fibrosis.Mucosal Immunol. 2008 Nov;1 Suppl 1(0 1):S24-7. doi: 10.1038/mi.2008.41. Mucosal Immunol. 2008. PMID: 19079223 Free PMC article. Review.
Cited by
-
Supercritical Fluid Extract of Angelica sinensis and Zingiber officinale Roscoe Ameliorates TNBS-Induced Colitis in Rats.Int J Mol Sci. 2019 Aug 5;20(15):3816. doi: 10.3390/ijms20153816. Int J Mol Sci. 2019. PMID: 31387229 Free PMC article.
-
Ferrous sulfate, but not iron polymaltose complex, aggravates local and systemic inflammation and oxidative stress in dextran sodium sulfate-induced colitis in rats.Drug Des Devel Ther. 2015 May 7;9:2585-97. doi: 10.2147/DDDT.S81863. eCollection 2015. Drug Des Devel Ther. 2015. PMID: 26005335 Free PMC article.
-
Hepcidin and Tissue-Specific Iron Regulatory Networks.Adv Exp Med Biol. 2025;1480:89-102. doi: 10.1007/978-3-031-92033-2_7. Adv Exp Med Biol. 2025. PMID: 40603786 Review.
References
-
- Mullin GE. Micronutrients and inflammatory bowel disease. Nutr Clin Pract. 2012;27:136–137. - PubMed
-
- Kent AJ, Blackwell VJ, Travis SP. What is the optimal treatment for anemia in inflammatory bowel disease? Curr Drug Deliv. 2012;9:356–366. - PubMed
-
- Finberg KE. Regulation of systemic iron homeostasis. Curr Opin Hematol. 2013;20:208–214. - PubMed
Publication types
MeSH terms
Substances
LinkOut - more resources
Full Text Sources
Other Literature Sources
Research Materials
Miscellaneous

