. 2014 Apr 2:5:56.
doi: 10.3389/fphar.2014.00056. eCollection 2014.

A PKA activity sensor for quantitative analysis of endogenous GPCR signaling via 2-photon FRET-FLIM imaging

Affiliations

A PKA activity sensor for quantitative analysis of endogenous GPCR signaling via 2-photon FRET-FLIM imaging

Yao Chen et al. Front Pharmacol. .

Erratum in

Abstract

Neuromodulators have profound effects on behavior, but the dynamics of their intracellular effectors has remained unclear. Most neuromodulators exert their function via G-protein-coupled receptors (GPCRs). One major challenge for understanding neuromodulator action is the lack of dynamic readouts of the biochemical signals produced by GPCR activation. The adenylate cyclase/cyclic AMP/protein kinase A (PKA) module is a central component of such biochemical signaling. This module is regulated by several behaviorally important neuromodulator receptors. Furthermore, PKA activity is necessary for the induction of many forms of synaptic plasticity as well as for the formation of long-term memory. In order to monitor PKA activity in brain tissue, we have developed a 2-photon fluorescence lifetime imaging microscopy (2pFLIM) compatible PKA sensor termed FLIM-AKAR, which is based on the ratiometric FRET sensor AKAR3. FLIM-AKAR shows a large dynamic range and little pH sensitivity. In addition, it is a rapidly diffusible cytoplasmic protein that specifically reports net PKA activity in situ. FLIM-AKAR expresses robustly in various brain regions with multiple transfection methods, can be targeted to genetically identified cell types, and responds to activation of both endogenous GPCRs and spatial-temporally specific delivery of glutamate. Initial experiments reveal differential regulation of PKA activity across subcellular compartments in response to neuromodulator inputs. Therefore, the reporter FLIM-AKAR, coupled with 2pFLIM, enables the study of PKA activity in response to neuromodulator inputs in genetically identified neurons in the brain, and sheds light on the intracellular dynamics of endogenous GPCR activation.

Keywords: FLIM; FLIM-AKAR; GPCR; PKA; cAMP; dendritic spine; glutamate; neuromodulation.


Figures

Figure 1
Figure 1
Development of a PKA sensor compatible with 2-photon Fluorescence Lifetime Imaging Microscopy (2pFLIM). (A) Diagram illustrating how PKA activity induces FRET in the reporter. Upon phosophrylation by PKA, the substrate region binds FHA domain, bringing the donor and acceptor together and resulting in FRET. The phosphorylated reporter leads to an increase of acceptor:donor emission ratio, as well as a decrease in donor fluorescence lifetime because of an additional energy transfer pathway. (B) Schematic of the original PKA reporter AKAR3 (Allen and Zhang, 2006) and three new PKA reporters.
Figure 2
Figure 2
AKAR3.4 reports PKA activity with the largest dynamic range in 2pFLIM measurements. (A) Image showing AKAR3.4 expression in Human Embryonic Kidney (HEK) cells 1 day after transfection. (B) Fluorescence decay curves following pulsed excitation. Application of the adenylate cyclase activator forskolin (50 μM) in AKAR3.4-transfected HEK cells results in faster decay and a decrease in lifetime, whereas application of the PKA inhibitor H89 (10 μM) reverses the decay curve to baseline. The offset arrival time, the time from the detection of photon excitation from the laser to the detection of the same pulse from the photomultiplier tube, is labeled in black, and the actual mean fluorescent lifetime τ is labeled in red. (C) Lifetime heat map of HEK cells transfected with AKAR3.4, showing lifetime changes induced by forskolin (FSK, 50 μM) followed by H89 (10 μM) treatment. (D) Example plots showing lifetime responses of the four different reporters to forskolin (50 μM, red bar) followed by H89 (10 μM, blue bar) treatment. Experiments were done in HEK cells transfected with the respective reporters. (E) Amplitudes of Δlifetime between baseline and forskolin (50 μM) treatments. (F) Change in the FRET fraction of photons (PFRET based on the annotation in Supplementary Figure 1) between baseline and forskolin (50 μM) treatments. For (E,F), n = 12, 10, 14, and 12 cells for AKAR, AKAR3.2, AKAR3.3, and AKAR3.4 respectively. *p < 0.003 when the amplitudes of the reporter and AKAR3.4 were compared (α = 0.017 for a familywise error rate of 0.05).
Figure 3
Figure 3
AKAR3.4 shows little sensitivity to pH. (A–D) Example plots showing responses of the four reporters to pH changes. Experiments were performed in HEK cells at room temperature in the presence of nigericin (5 μM) and the PKA inhibitor H89 (10 μM). Extracellular solutions buffered to different pH values were applied. (E) Summary graph showing Δlifetime in response to different pH in HEK cells. Δlifetime was measured relative to that at pH 7.5. n = 8, 8, 7, and 7 cells for AKAR3, AKAR3.2, AKAR3.3, and AKAR3.4 respectively. Graphs show mean and SEMs.
Figure 4
Figure 4
FLIM-AKAR shows similar diffusion properties to a rapidly diffusing cytoplasmic protein. (A–E) Fluorescence Recovery After Photobleaching (FRAP) experiments to measure the spreading of FLIM-AKAR. (A) Image of FLIM-AKAR donor fluorescence of a dendritic region of a hippocampal CA1 neuron cultured in organotypic slices. The arrowhead shows the spine that was photobleached. The dashed line shows the region being imaged by line scan. (B) Fluorescence measured in line scans for the region indicated by dashed line in (A). (C) Quantification of FRAP for the spine shown in (A,B). The trace was an average of 4 acquisitions. The red trace shows curve fitting with a single exponential decay. (D,E) Cumulative distribution of τ from FRAP experiments to examine FLIM-AKAR spreading from spines (D) and for aspiny regions of dendrites (E) in hippocampal CA1 neurons.
Figure 5
Figure 5
FLIM-AKAR is specific for PKA following adenylate cyclase activation by forskolin. All experiments were performed in HEK cells. Red line indicates bath application of 50 μM forsklin (FSK) and blue line indicates bath application of 10 μM H89. (A) Schematic illustrating introduction of the point mutation T391A that renders the PKA phosophorylation site of FLIM-AKAR non-functional. (B) Example plots showing FLIM-AKAR lifetime response to adenylate cyclase activation by forskolin (red) and subsequent PKA inhibition by H89 (blue) (top), and the lack of a response from the non-phosphorylatable point mutant FLIM-AKART391A (bottom). (C) Summary bar graph showing Δlifetime from baseline to forskolin treatment for FLIM-AKAR (n = 9 cells) and the non-phosphorylatable mutant of FLIM-AKAR (n = 11 cells). *p < 10−5. (D) Schematic illustrating how PKI inhibits PKA activity. Without PKI, binding of cAMP to the regulatory subunits of PKA (R) frees the catalytic subunits (C), resulting in activation of PKA. With PKI, even though cAMP binding to the regulatory subunits dissociates them from the catalytic subunits, PKI can bind to the catalytic subunits of PKA and inhibit their activity. (E) Example plot showing FLIM-AKAR response to adenylate cyclase activation and subsequent PKA inhibition (top), and the lack of a lifetime response by FLIM-AKAR when it was co-transfected with PKIα (bottom). (F) Summary bar graph showing Δlifetimes from baseline to forskolin treatment for FLIM-AKAR, in the absence (n = 18 cells) and presence (n = 10 cells) of PKI. *p < 10−9.
Figure 6
Figure 6
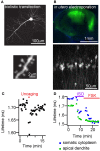
FLIM-AKAR shows high expression with different transfection methods and lifetime responses to glutamate or GPCR activation in the hippocampus. (A) Images showing a hippocampal CA1 neuron (top), dendrite and spines (bottom) from an organotypic slice transfected with FLIM-AKAR with biolistic method. (B) Image showing a 300 μm acute hippocampal slice expressing FLIM-AKAR in CA1 region after in utero electroporation. (C) Example plot of lifetime change of FLIM-AKAR in a stimulated spine in response to photolysis of caged glutamate adjacent to the spine. A CA1 pyramidal neuron in an organotypic hippocampal slice was biolistically transfected with FLIM-AKAR, and the stimulated spine shows enlargement following 2-photon photolysis of caged glutamate (MNI-glutamate). The temporal window of uncaging is indicated in the red bar above. (D) Lifetime response of FLIM-AKAR upon isoproterenol (1 μM, ISO) treatment to activate β-adrenergic receptors followed by forskolin (50 μM, FSK) treatment to activate adenylate cyclases. The experiment was done in acute hippocampal slice expressing FLIM-AKAR in CA1 region after in utero electroporation.
Figure 7
Figure 7
FLIM-AKAR can be targeted to genetically defined cell types and reports modulation of PKA by endogenous GPCRs in the striatum. (A) AAV plasmid map showing how Cre recombinase leads to AKAR3.4 expression. (B–D) A Cre-dependent AAV virus carrying FLIM-AKAR was delivered to the striatum of an Adora2a BAC-Cre mouse. (B) Lifetime heat map of an indirect pathway striatal spiny projection neuron (iSPN) in an acute striatal slice. Following A2AR activation by its agonist CGS21680, cytoplasmic FLIM-AKAR became rapidly phosphorylated, while nuclear FLIM-AKAR showed a slower response. (C) A parasagittal brain section showing FLIM-AKAR expression in the striatum. (D) Example plots showing modulation of PKA by A2AR in an iSPN. 1 μM CGS21680 was used to activate A2AR. (E) A Cre-dependent AAV virus carrying FLIM-AKAR was delivered to the striatum of a Drd1 BAC-Cre mouse to target direct pathway SPNs (dSPNs). Example plots showing modulation of PKA by SKF81297 in a dSPN. 1 μM SKF81297 was used to activate D1R.

References

    1. Albin R. L., Young A. B., Penney J. B. (1989). The functional anatomy of basal ganglia disorders. Trends Neurosci. 12, 366–375 10.1016/0166-2236(89)90074-X - DOI - PubMed
    1. Allen M. D., Zhang J. (2006). Subcellular dynamics of protein kinase A activity visualized by FRET-based reporters. Biochem. Biophys. Res. Commun. 348, 716–721 10.1016/j.bbrc.2006.07.136 - DOI - PubMed
    1. Ashby C. D., Walsh D. A. (1972). Characterization of the interaction of a protein inhibitor with adenosine 3′,5′-monophosphate-dependent protein kinases. I. Interaction with the catalytic subunit of the protein kinase. J. Biol. Chem. 247, 6637–6642 - PubMed
    1. Ashby C. D., Walsh D. A. (1973). Characterization of the interaction of a protein inhibitor with adenosine 3′,5′-monophosphate-dependent protein kinases. II. Mechanism of action with the holoenzyme. J. Biol. Chem. 248, 1255–1261 - PubMed
    1. Atasoy D., Aponte Y., Su H. H., Sternson S. M. (2008). A FLEX switch targets Channelrhodopsin-2 to multiple cell types for imaging and long-range circuit mapping. J. Neurosci. 28, 7025–7030 10.1523/JNEUROSCI.1954-08.2008 - DOI - PMC - PubMed

LinkOut - more resources