Effects of cordycepin on HepG2 and EA.hy926 cells: Potential antiproliferative, antimetastatic and anti-angiogenic effects on hepatocellular carcinoma
- PMID: 24765175
- PMCID: PMC3997733
- DOI: 10.3892/ol.2014.1965
Effects of cordycepin on HepG2 and EA.hy926 cells: Potential antiproliferative, antimetastatic and anti-angiogenic effects on hepatocellular carcinoma
Abstract
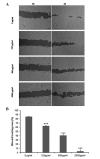
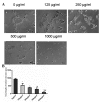
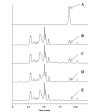
Hepatocellular carcinoma (HCC) is a hypervascular tumor and accumulating evidence suggests that angiogenesis plays an important role in HCC development. Cordycepin, also known as 3'-deoxyadenosine, is a derivative of adenosine, and numerous cellular enzymes cannot differentiate the two. The aim of the present study was to determine whether cordycepin regulates proliferation, migration and angiogenesis in a human umbilical vein endothelial cell line (EA.hy926) and in a hepatocellular carcinoma cell line (HepG2). MTT was used to assess cell proliferation. Apoptosis was analyzed by flow cytometry (propidium iodide staining). Transwell and wound healing assays were used to analyze the migration and invasion of HepG2 and EA.hy926 cells. Angiogenesis in EA.hy926 cells was assessed using a tube formation assay. Cordycepin strongly suppressed HepG2 and EA.hy926 cell proliferation in a dose- and time-dependent manner. Cordycepin induced EA.hy926 cell apoptosis in a dose-dependent manner (2,000 μg/ml: 50.20±1.55% vs. 0 μg/ml: 2.62±0.19%; P<0.01). Cordycepin inhibited EA.hy926 cell migration (percentage of wound healing area, 2,000 μg/ml: 3.45±0.29% vs. 0 μg/ml: 85.48±0.84%; P<0.05), as well as tube formation (total length of tubular structure, 1,000 μg/ml: 107±39 μm vs. 0 μg/ml: 936±56 μm; P<0.05). Cordycepin also efficiently inhibited HepG2 cell invasion and migration. High-performance liquid chromatography analysis of the cytosol from EA.hy926 cells showed that cordycepin was stable for 3 h. In conclusion, cordycepin not only inhibited human HepG2 cell proliferation and invasion, but also induced apoptosis and inhibited migration and angiogenesis in vascular endothelial cells, suggesting that cordycepin may be used as a novel anti-angiogenic therapy in HCC.
Keywords: angiogenesis; apoptosis; cordycepin; hepatocellular carcinoma; invasion; vascular endothelial cells.
Figures


Similar articles
-
Cross-talk mechanism between endothelial cells and hepatocellular carcinoma cells via growth factors and integrin pathway promotes tumor angiogenesis and cell migration.Oncotarget. 2017 Jun 27;8(41):69577-69593. doi: 10.18632/oncotarget.18632. eCollection 2017 Sep 19. Oncotarget. 2017. PMID: 29050226 Free PMC article.
-
Cordycepin Suppresses Endothelial Cell Proliferation, Migration, Angiogenesis, and Tumor Growth by Regulating Focal Adhesion Kinase and p53.Cancers (Basel). 2019 Feb 1;11(2):168. doi: 10.3390/cancers11020168. Cancers (Basel). 2019. PMID: 30717276 Free PMC article.
-
[Influence of Tumor Microenvironment of Hepatocellular Carcinoma on the Proliferation of Vascular Endothelial Cells and Vascular Angiogenesis Ability].Sheng Wu Yi Xue Gong Cheng Xue Za Zhi. 2015 Jun;32(3):612-7. Sheng Wu Yi Xue Gong Cheng Xue Za Zhi. 2015. PMID: 26485987 Chinese.
-
Plumbagin restrains hepatocellular carcinoma angiogenesis by suppressing the migration and invasion of tumor-derived vascular endothelial cells.Oncotarget. 2017 Feb 28;8(9):15230-15241. doi: 10.18632/oncotarget.14774. Oncotarget. 2017. PMID: 28122355 Free PMC article.
-
[Role of PD 0332991 on the Proliferation and Apoptosis of Vascular Endothelial Cells].Zhongguo Fei Ai Za Zhi. 2018 May 20;21(5):375-382. doi: 10.3779/j.issn.1009-3419.2018.05.04. Zhongguo Fei Ai Za Zhi. 2018. PMID: 29764587 Free PMC article. Chinese.
Cited by
-
Polysaccharides obtained from mycelia of Cordyceps militaris attenuated doxorubicin-induced cytotoxic effects in chemotherapy.Afr Health Sci. 2019 Jun;19(2):2156-2163. doi: 10.4314/ahs.v19i2.40. Afr Health Sci. 2019. PMID: 31656500 Free PMC article.
-
Optimal conditions for cordycepin production in surface liquid-cultured Cordyceps militaris treated with porcine liver extracts for suppression of oral cancer.J Food Drug Anal. 2018 Jan;26(1):135-144. doi: 10.1016/j.jfda.2016.11.021. Epub 2017 Feb 16. J Food Drug Anal. 2018. PMID: 29389548 Free PMC article.
-
Polysaccharides Obtained from Cordyceps militaris Alleviate Hyperglycemia by Regulating Gut Microbiota in Mice Fed a High-Fat/Sucrose Diet.Foods. 2021 Aug 12;10(8):1870. doi: 10.3390/foods10081870. Foods. 2021. PMID: 34441649 Free PMC article.
-
Cigarette smoke induces angiogenic activation in the cancer field through dysregulation of an endothelial microRNA.Commun Biol. 2025 Mar 28;8(1):511. doi: 10.1038/s42003-025-07710-y. Commun Biol. 2025. PMID: 40155749 Free PMC article.
-
Cordyceps militaris: A Comprehensive Study on Laboratory Cultivation and Anticancer Potential in Dalton's Ascites Lymphoma Tumor Model.Anticancer Agents Med Chem. 2024;24(9):668-690. doi: 10.2174/0118715206282174240115082518. Anticancer Agents Med Chem. 2024. PMID: 38305294
References
-
- McGlynn KA, London WT. Epidemiology and natural history of hepatocellular carcinoma. Best Pract Res Clin Gastroenterol. 2005;19:3–23. - PubMed
-
- Parkin DM, Bray F, Ferlay J, Pisani P. Global cancer statistics, 2002. CA Cancer J Clin. 2005;55:74–108. - PubMed
-
- Llovet JM, Burroughs A, Bruix J. Hepatocellular carcinoma. Lancet. 2003;362:1907–1917. - PubMed
-
- Azam F, Koulaouzidis A. Hepatitis B virus and hepatocarcinogenesis. Ann Hepatol. 2008;7:125–129. - PubMed
-
- Bosch FX, Ribes J, Diaz M, Cleries R. Primary liver cancer: worldwide incidence and trends. Gastroenterology. 2004;127(5 Suppl 1):S5–S16. - PubMed
LinkOut - more resources
Full Text Sources
Other Literature Sources
