

Expression of SDF-1 and CXCR4 transcript variants and CXCR7 in epithelial ovarian cancer
- PMID: 24765189
- PMCID: PMC3997724
- DOI: 10.3892/ol.2014.1897
Expression of SDF-1 and CXCR4 transcript variants and CXCR7 in epithelial ovarian cancer
Abstract
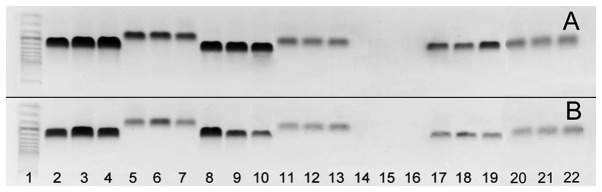
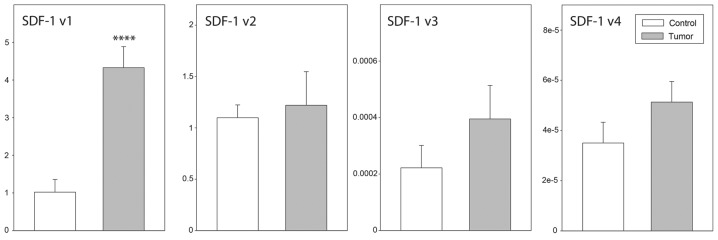
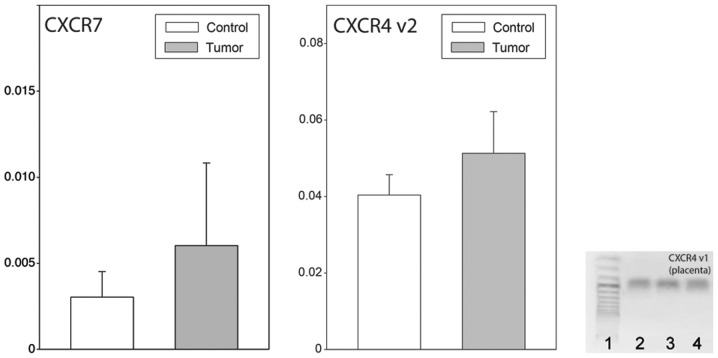
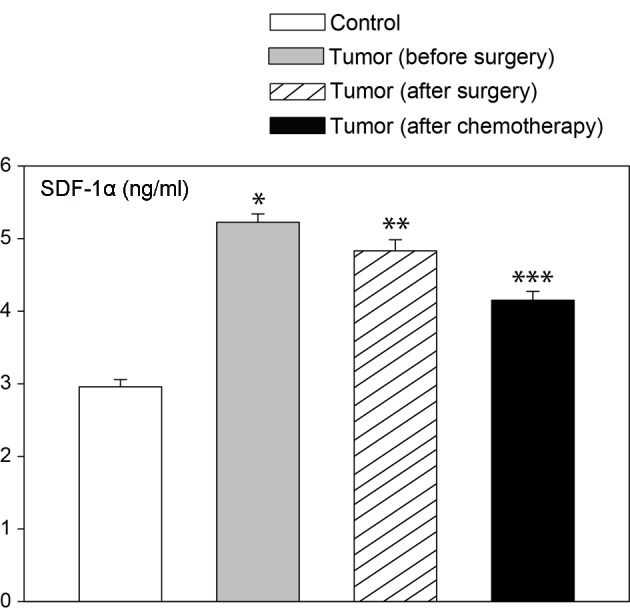
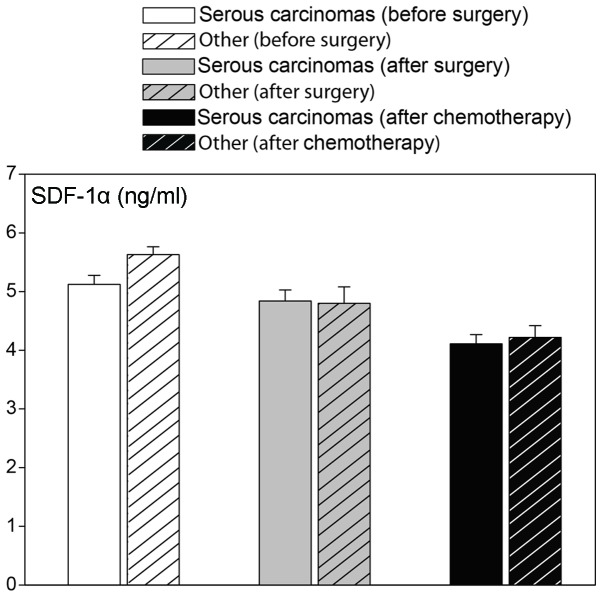
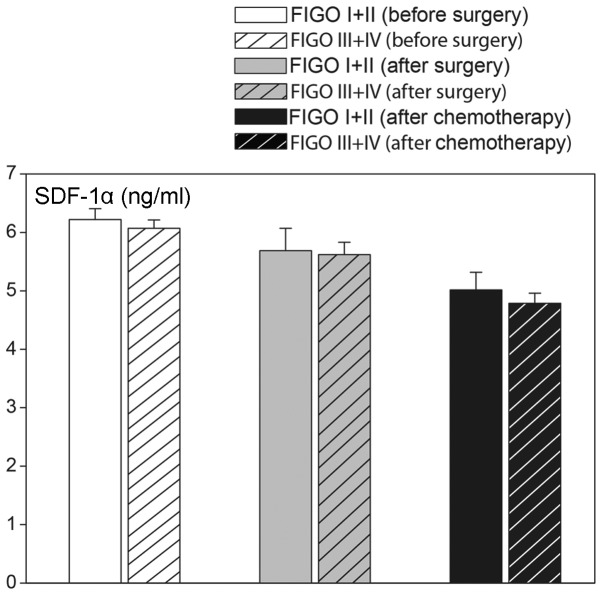
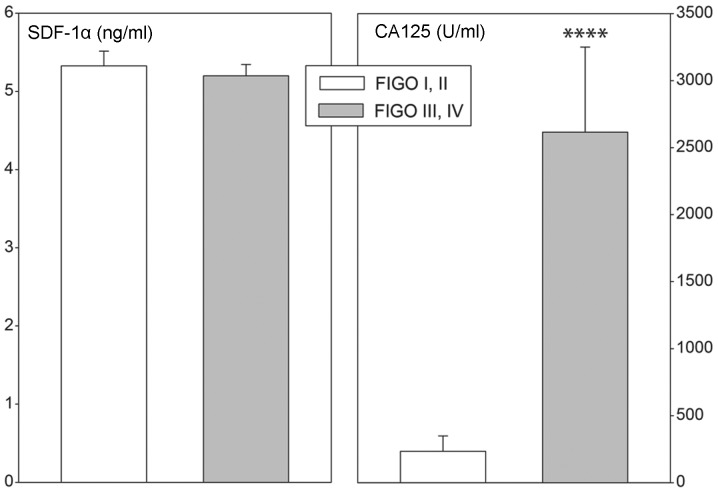
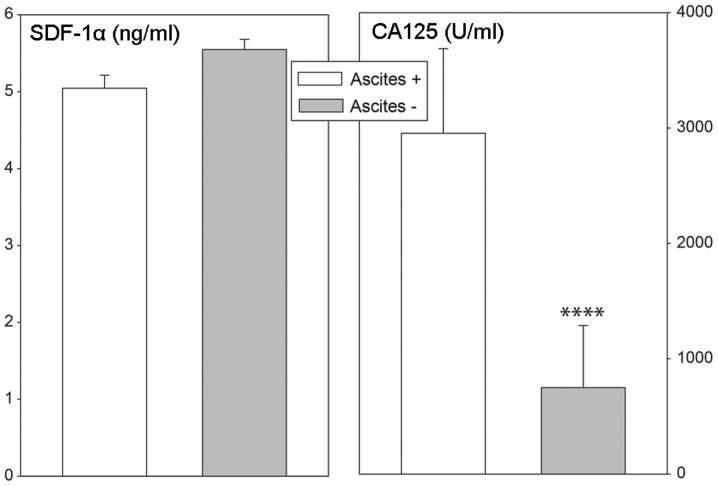
Chemokine stromal cell-derived factor-1 (SDF-1) and its receptors, CXCR4 and CXCR7, have been implicated in epithelial ovarian cancer progression and metastasis. However, limited data are available on the expression levels of SDF-1 and CXCR4 variants and CXCR7 in human epithelial ovarian cancer. The present study aimed to characterize the expression pattern and levels of SDF-1, CXCR4 and CXCR7 in normal human ovaries and epithelial ovarian cancer. The expression of SDF-1 and CXCR4 transcript variants and CXCR7 was determined by quantitative polymerase chain reaction (qPCR). Plasma SDF-1α levels were determined by commercially available EIA kits and cancer antigen 125 (CA 125) levels were quantified by automated microparticle enzyme immunosorbent assay. High expression levels of SDF-1 transcript variant 1 were identified in ovarian cancer and control ovaries. By contrast, in both groups the expression levels of SDF-1 transcript variants 3 and 4 were extremely low. Furthermore, SDF-1 variant 1 levels were notably higher in epithelial ovarian cancer than in control ovaries, while data for the remaining transcripts were similar in both groups. CXCR4 transcript variant 2 and CXCR7 expression levels in normal and neoplastic ovaries were similar. In both groups, CXCR4 transcript variant 2 was not detected. Plasma SDF-1α levels were notably higher in females with epithelial ovarian cancer than in the control ovaries. Elevated levels of blood SDF-1α were found prior to surgery, 6 days after surgery and following completion of the first chemotherapy course. These increases were independent of the type of epithelial ovarian cancer. Our results suggest that the expression of SDF-1 and the genes controlling alternative splicing are elevated in epithelial ovarian cancer, leading to an increased formation of SDF-1 variant 1. Elevated plasma SDF-1α levels in epithelial ovarian cancer patients are not associated with the presence of tumors and/or metastases, however reflect a general response to the disease.
Keywords: CXCR4; CXCR7; SDF-1; epithelial ovarian cancer; plasma CA 125; plasma SDF-1α; transcript variants.
Figures
Similar articles
-
The disparate twins: a comparative study of CXCR4 and CXCR7 in SDF-1α-induced gene expression, invasion and chemosensitivity of colon cancer.Clin Cancer Res. 2014 Feb 1;20(3):604-16. doi: 10.1158/1078-0432.CCR-13-0582. Epub 2013 Nov 19. Clin Cancer Res. 2014. PMID: 24255072
-
The potential role of stromal cell-derived factor-1α/CXCR4/CXCR7 axis in adipose-derived mesenchymal stem cells.J Cell Physiol. 2020 Apr;235(4):3548-3557. doi: 10.1002/jcp.29243. Epub 2019 Sep 30. J Cell Physiol. 2020. PMID: 31566725
-
Stromal cell derived factor-1, CXCR4 and CXCR7 gene transcripts in pterygia.J Curr Ophthalmol. 2016 Dec 27;29(1):28-32. doi: 10.1016/j.joco.2016.10.006. eCollection 2017 Mar. J Curr Ophthalmol. 2016. PMID: 28367523 Free PMC article.
-
Platelet-derived growth factor-BB promotes proliferation and migration of retinal microvascular pericytes by up-regulating the expression of C-X-C chemokine receptor types 4.Exp Ther Med. 2019 Nov;18(5):4022-4030. doi: 10.3892/etm.2019.8016. Epub 2019 Sep 17. Exp Ther Med. 2019. PMID: 31611940 Free PMC article.
-
Functions and mechanisms of chemokine receptor 7 in tumors of the digestive system.World J Clin Cases. 2020 Jun 26;8(12):2448-2463. doi: 10.12998/wjcc.v8.i12.2448. World J Clin Cases. 2020. PMID: 32607322 Free PMC article. Review.
Cited by
-
Feedback control of the CXCR7/CXCL11 chemokine axis by estrogen receptor α in ovarian cancer.Mol Oncol. 2018 Oct;12(10):1689-1705. doi: 10.1002/1878-0261.12362. Epub 2018 Aug 23. Mol Oncol. 2018. PMID: 30051594 Free PMC article.
-
Important role of the SDF-1/CXCR4 axis in the homing of systemically transplanted human amnion-derived mesenchymal stem cells (hAD-MSCs) to ovaries in rats with chemotherapy-induced premature ovarian insufficiency (POI).Stem Cell Res Ther. 2022 Feb 23;13(1):79. doi: 10.1186/s13287-022-02759-6. Stem Cell Res Ther. 2022. PMID: 35197118 Free PMC article.
-
CXCL12/CXCR4: a symbiotic bridge linking cancer cells and their stromal neighbors in oncogenic communication networks.Oncogene. 2016 Feb 18;35(7):816-26. doi: 10.1038/onc.2015.139. Epub 2015 May 11. Oncogene. 2016. PMID: 25961926 Review.
-
The N-terminus of CXCR4 splice variants determines expression and functional properties.PLoS One. 2023 May 4;18(5):e0283015. doi: 10.1371/journal.pone.0283015. eCollection 2023. PLoS One. 2023. PMID: 37141381 Free PMC article.
-
Microvesicles and chemokines in tumor microenvironment: mediators of intercellular communications in tumor progression.Mol Cancer. 2019 Mar 30;18(1):50. doi: 10.1186/s12943-019-0973-7. Mol Cancer. 2019. PMID: 30925930 Free PMC article. Review.
References
-
- Tashiro K, Tada H, Heilker R, et al. Signal sequence trap: a cloning strategy for secreted proteins and type I membrane proteins. Science. 1993;261:600–603. - PubMed
-
- Murphy PM, Baggiolini M, Charo IF, et al. International union of pharmacology. XXII Nomenclature for chemokine receptors. Pharmacol Rev. 2000;52:145–176. - PubMed
-
- Balabanian K, Lagane B, Infantino S, et al. The chemokine SDF-1/CXCL12 binds to and signals through the orphan receptor RDC1 in T lymphocytes. J Biol Chem. 2005;280:35760–35766. - PubMed
-
- Ratajczak MZ, Zuba-Surma E, Kucia M, et al. The pleiotropic effects of the SDF-1-CXCR4 axis in organogenesis, regeneration and tumorigenesis. Leukemia. 2006;20:1915–1924. - PubMed
LinkOut - more resources
Full Text Sources
Other Literature Sources
Research Materials