. 2014 Apr 1:6.
doi: 10.3402/jom.v6.23609. eCollection 2014.

Bacterial profiles of saliva in relation to diet, lifestyle factors, and socioeconomic status

Affiliations

Bacterial profiles of saliva in relation to diet, lifestyle factors, and socioeconomic status

Daniel Belstrøm et al. J Oral Microbiol. .

Abstract

Background and objective: The bacterial profile of saliva is composed of bacteria from different oral surfaces. The objective of this study was to determine whether different diet intake, lifestyle, or socioeconomic status is associated with characteristic bacterial saliva profiles.

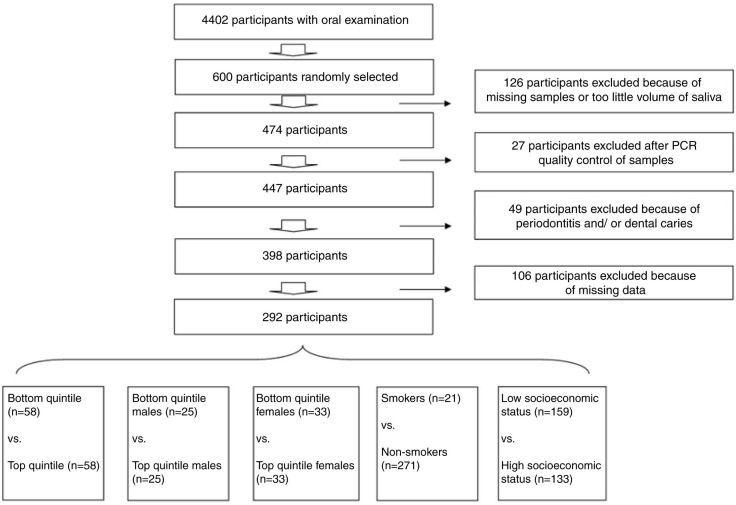
Design: Stimulated saliva samples from 292 participants with low levels of dental caries and periodontitis, enrolled in the Danish Health Examination Survey (DANHES), were analyzed for the presence of approximately 300 bacterial species by means of the Human Oral Microbe Identification Microarray (HOMIM). Using presence and levels (mean HOMIM-value) of bacterial probes as endpoints, the influence of diet intake, lifestyle, and socioeconomic status on the bacterial saliva profile was analyzed by Mann-Whitney tests with Benjamini-Hochberg's correction for multiple comparisons and principal component analysis.

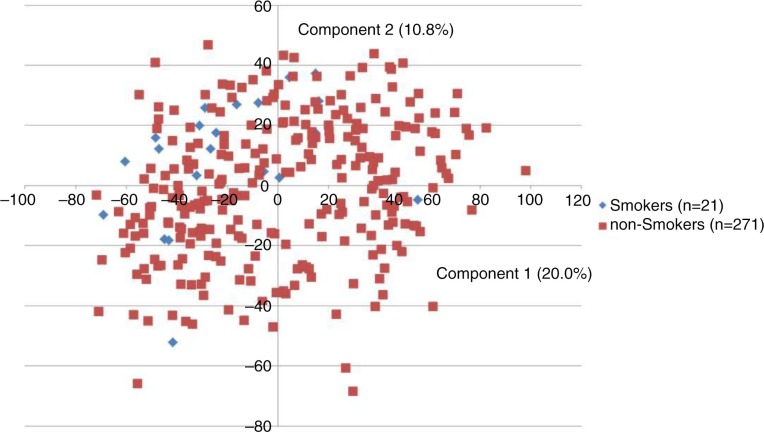
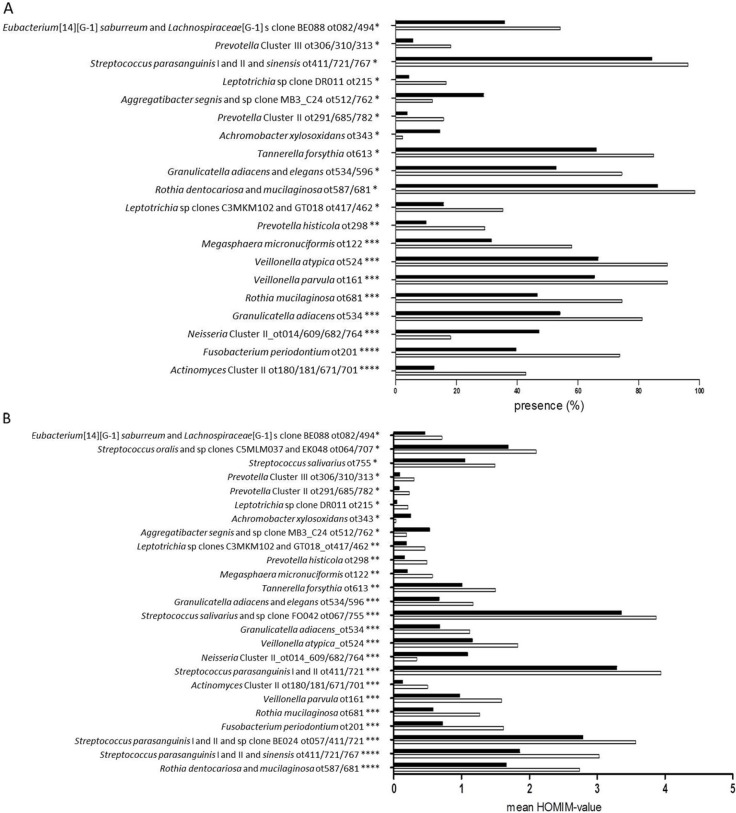
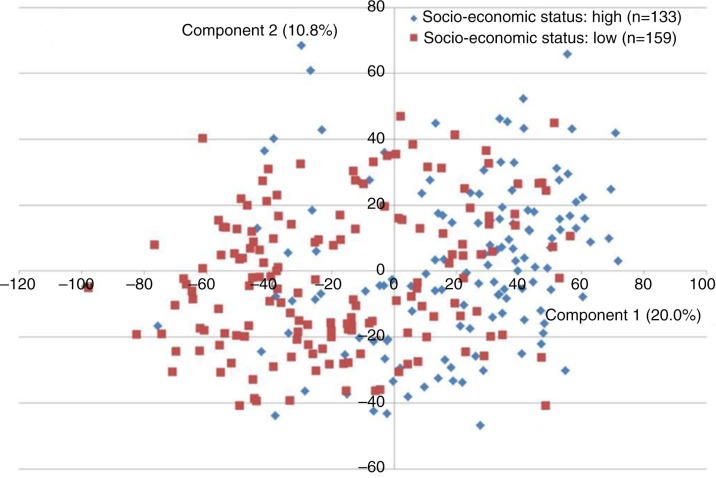
Results: Targets for 131 different probes were identified in 292 samples, with Streptococcus and Veillonella being the most predominant genera identified. Two bacterial taxa (Streptococcus sobrinus and Eubacterium [11][G-3] brachy) were more associated with smokers than non-smokers (adjusted p-value<0.01). Stratification of the group based on extreme ends of the parameters age, gender, alcohol consumption, body mass index (BMI), and diet intake had no statistical influence on the composition of the bacterial profile of saliva. Conversely, differences in socioeconomic status were reflected by the bacterial profiles of saliva.

Conclusions: The bacterial profile of saliva seems independent of diet intake, but influenced by smoking and maybe socioeconomic status.

Keywords: HOMIM; bacteria; diet lifestyle; saliva.


Figures

Fig. 1
Fig. 1
Flowchart of sample selection and group establishment.
Fig. 2
Fig. 2
Principal component analysis of smoking status. Smokers (blue, n=21) and non-smokers (red, n=271) displayed 2-dimensionally with principal component analysis by the 2 principal components, accounting for 30.8% of the variation of the dataset using mean HOMIM-value (level), as parameter for investigation.
Fig. 3
Fig. 3
Differences at taxon/cluster level by socioeconomic status. A. The 20 statistically significant probes are presented based on presence (%) of total amount of samples in the high and low socioeconomic status subgroup, respectively. Black bars: low socioeconomic status subgroup. White bars: high socioeconomic status subgroup. *Adjusted p-value < 0.01, *adjusted p-value < 0.001, ***adjusted p-value < 1.0×10⁻⁴, ****adjusted p-value < 1.0×10⁻⁶. B. Levels (mean HOMIM-value) of the 25 statistically significant probes are visualized based on means of HOMIM-value in samples from the high and low socioeconomic status subgroup. Black bars: low socioeconomic status subgroup. White bars: high socioeconomic status subgroup. *Adjusted p-value < 0.01, **adjusted p-value < 0.001, ***adjusted p-value < 1.0×10⁻⁵, ****adjusted p-value < 1.0×10⁻¹².
Fig. 4
Fig. 4
Principal component analysis of socioeconomic status. The subgroup with high socioeconomic status (blue, n=133) and the subgroup with low socioeconomic status (red, n=159) visualized 2-dimensionally by principal component analysis, with axes expressing the 2 most crucial components accounting for 30.8% of the total variation of the dataset.

Similar articles

Cited by

References

    1. Aas JA, Paster BJ, Stokes LN, Olsen I, Dewhirst FE. Defining the normal bacterial flora of the oral cavity. J Clin Microbiol. 2005;43:5721–32. - PMC - PubMed
    1. Paster BJ, Boches SK, Galvin JL, Ericson RE, Lau CN, Levanos VA, et al. Bacterial diversity in human subgingival plaque. J Bacteriol. 2001;183:3770–83. - PMC - PubMed
    1. Jenkinson HF, Lamont RJ. Oral microbial communities in sickness and in health. Trends Microbiol. 2005;13:589–95. - PubMed
    1. Dewhirst FE, Chen T, Izard J, Paster BJ, Tanner AC, Yu WH, et al. The human oral microbiome. J Bacteriol. 2010;192:5002–17. - PMC - PubMed
    1. Bik EM, Long CD, Armitage GC, Loomer P, Emerson J, Mongodin EF, et al. Bacterial diversity in the oral cavity of 10 healthy individuals. ISME J. 2010;4:962–74. - PMC - PubMed

LinkOut - more resources