. 2014;28(7):879-95.
doi: 10.3109/02699052.2014.888478. Epub 2014 Mar 21.

Investigation of blast-induced traumatic brain injury

Affiliations
Free PMC article

Investigation of blast-induced traumatic brain injury

Paul A Taylor et al. Brain Inj. 2014.
Free PMC article

Abstract

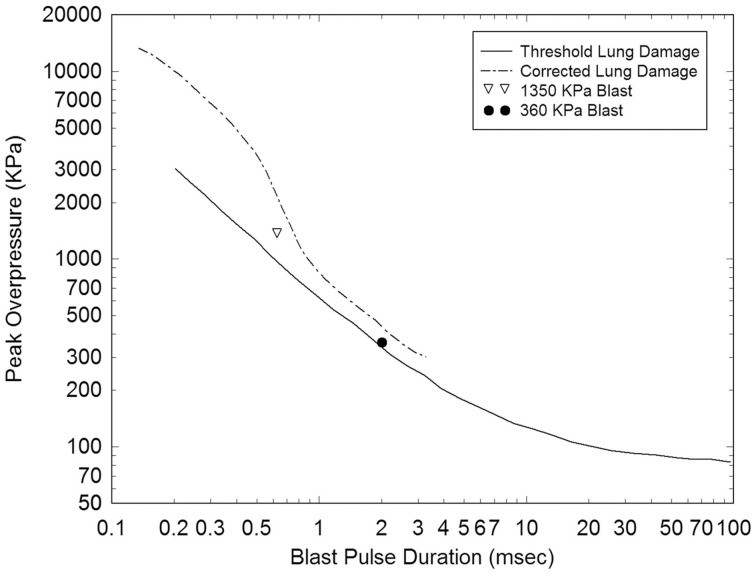
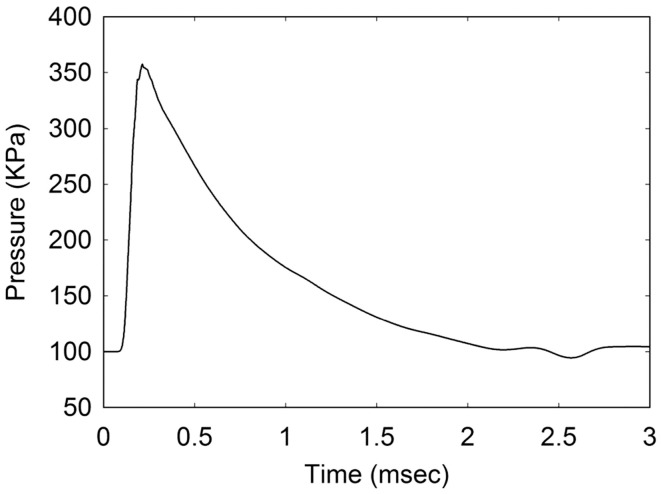
Objective: Many troops deployed in Iraq and Afghanistan have sustained blast-related, closed-head injuries from being within non-lethal distance of detonated explosive devices. Little is known, however, about the mechanisms associated with blast exposure that give rise to traumatic brain injury (TBI). This study attempts to identify the precise conditions of focused stress wave energy within the brain, resulting from blast exposure, which will correlate with a threshold for persistent brain injury.

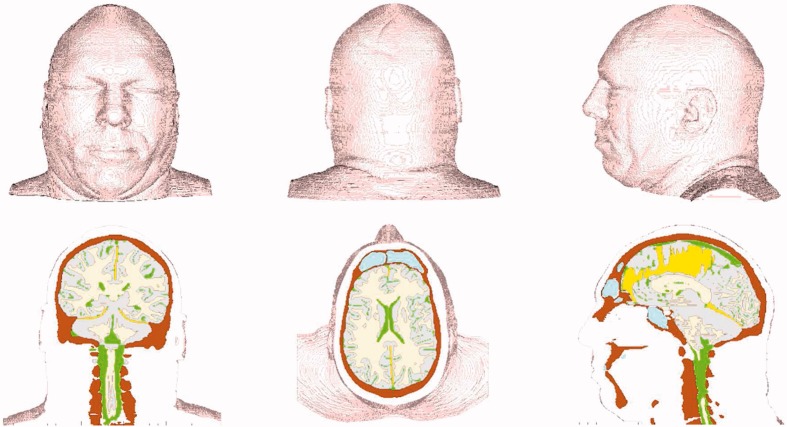
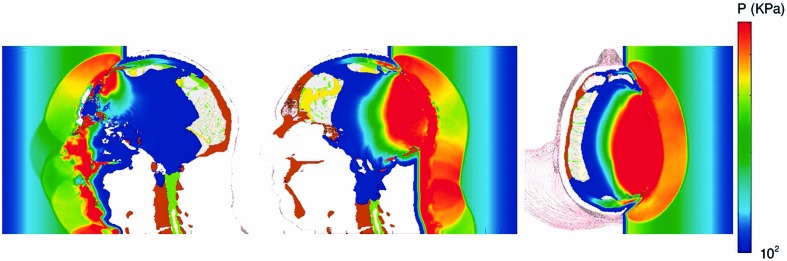
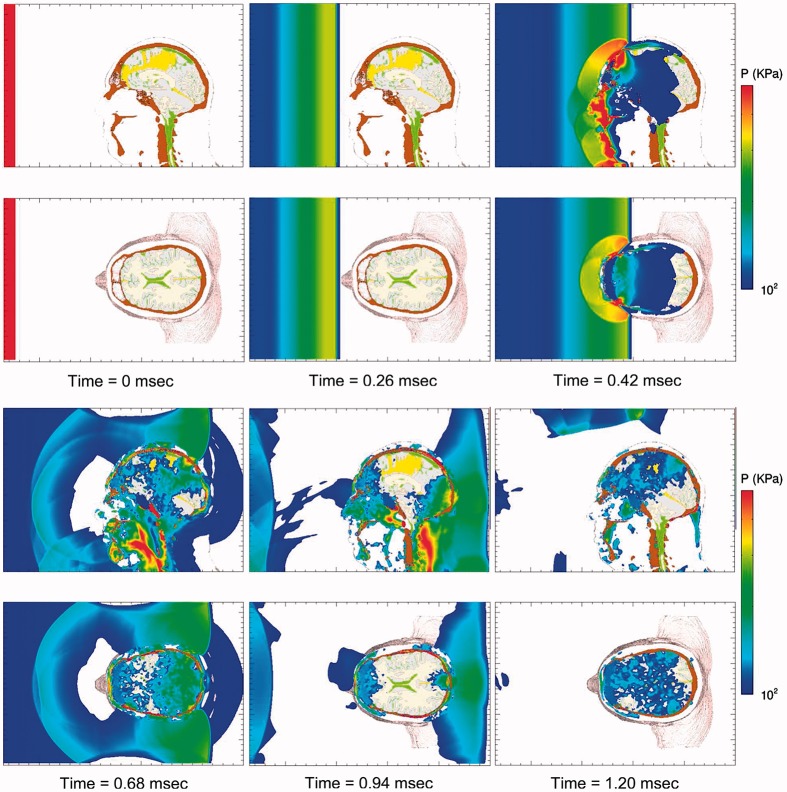
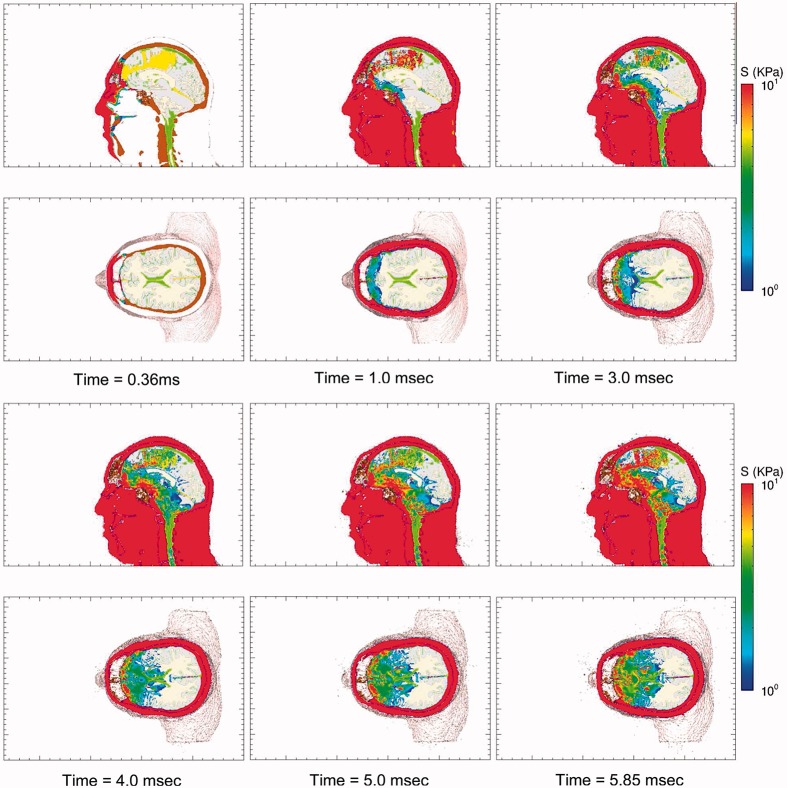
Methods: This study developed and validated a set of modelling tools to simulate blast loading to the human head. Using these tools, the blast-induced, early-time intracranial wave motions that lead to focal brain damage were simulated.

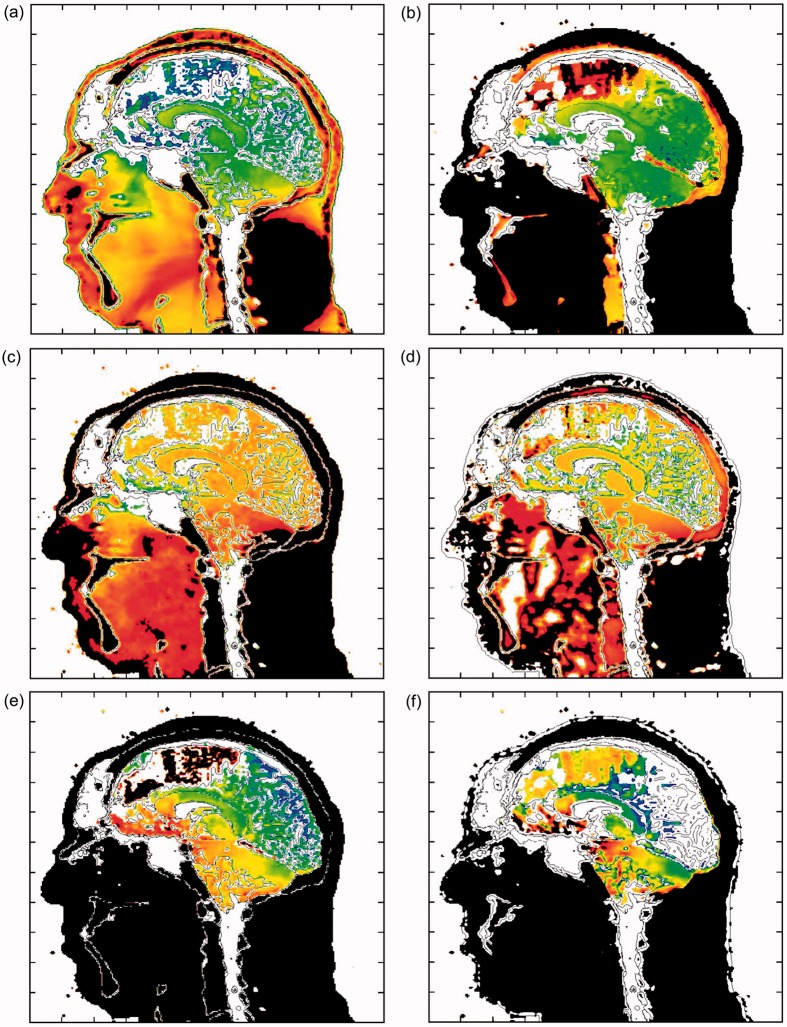
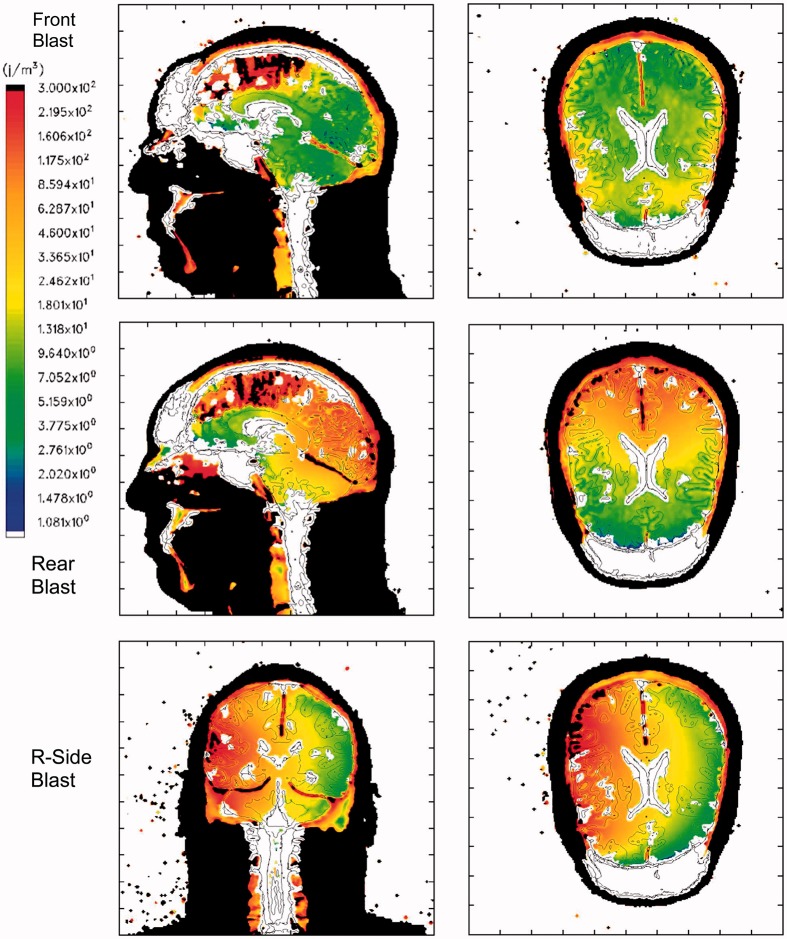
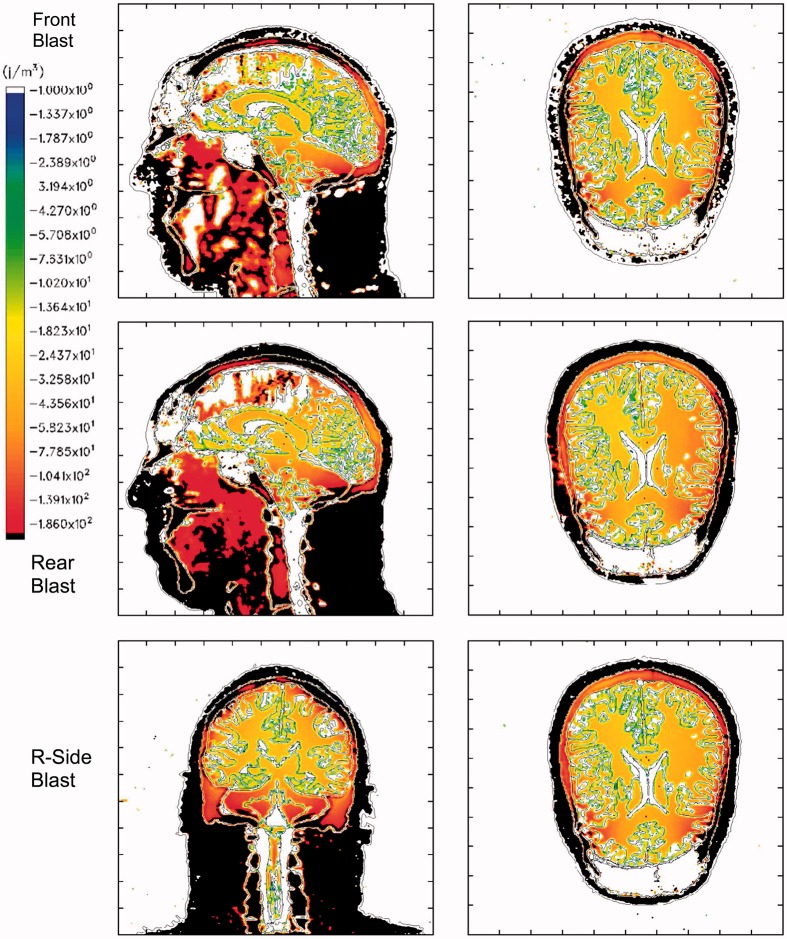
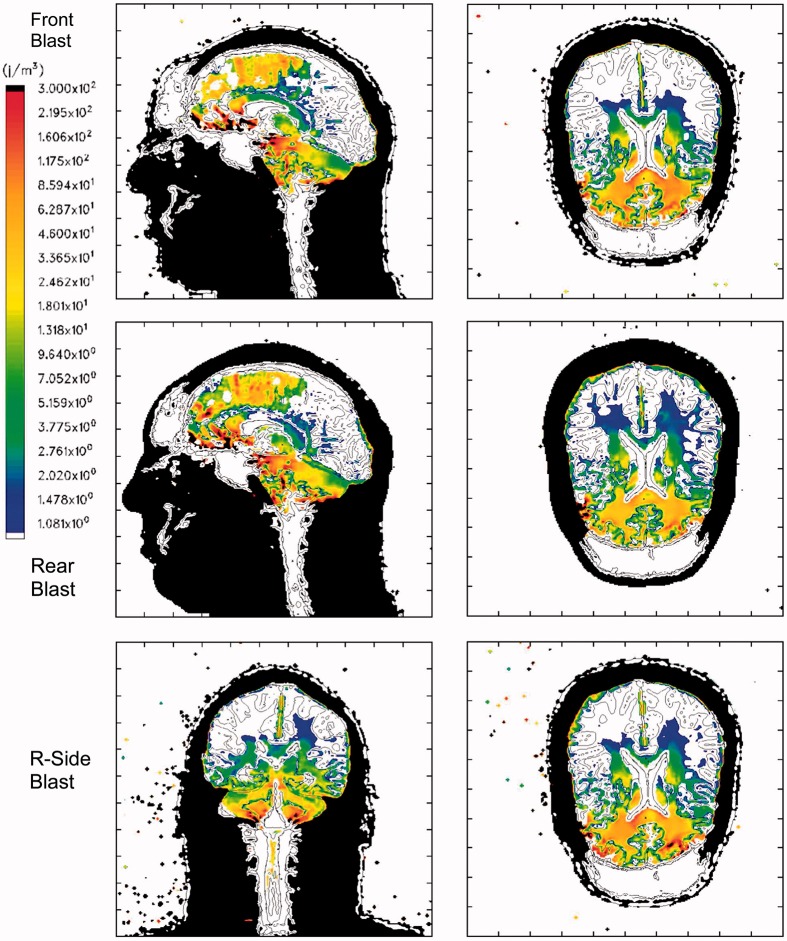
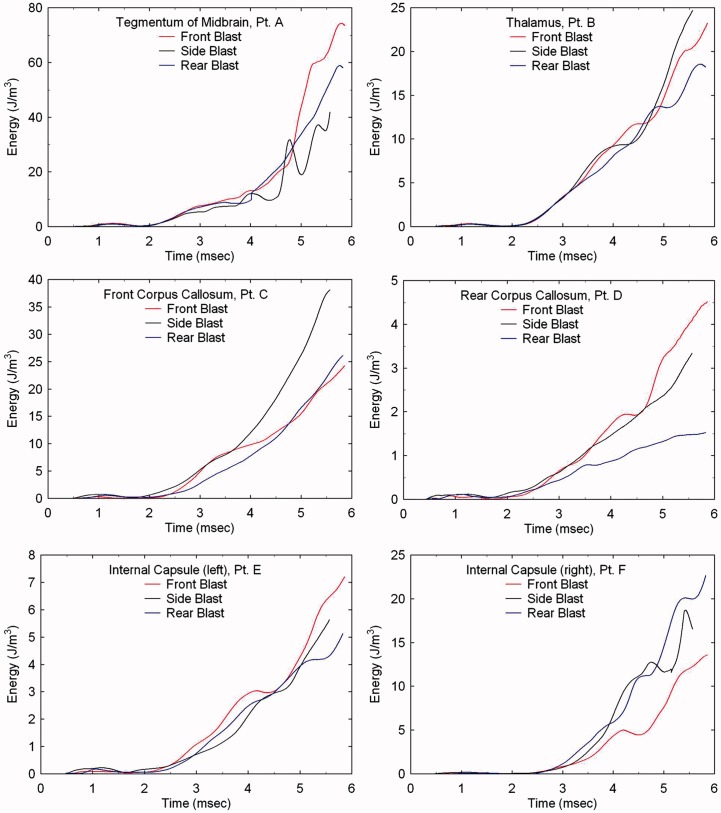
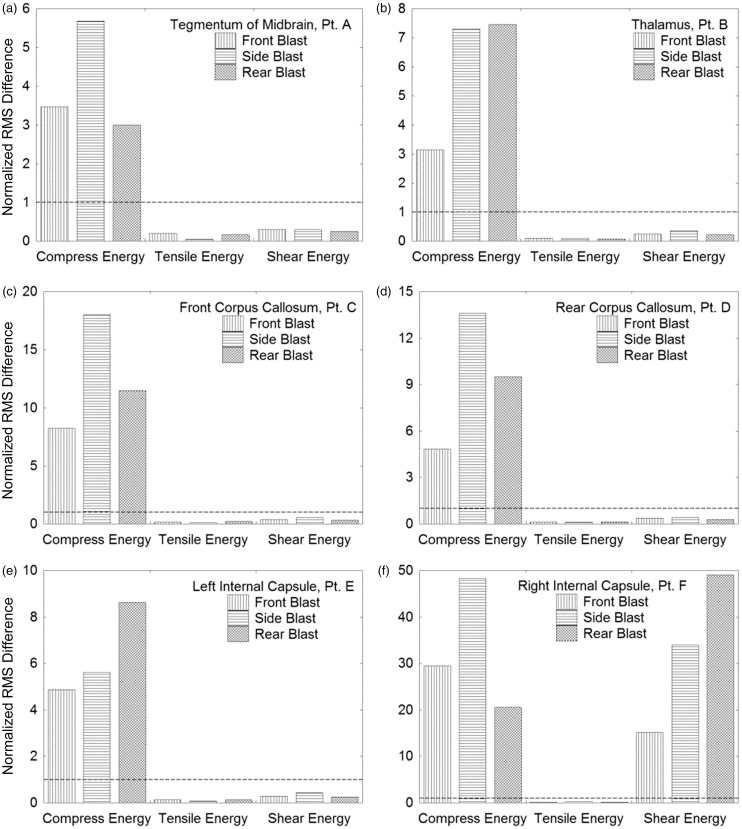
Results: The simulations predict the deposition of three distinct wave energy components, two of which can be related to injury-inducing mechanisms, namely cavitation and shear. Furthermore, the results suggest that the spatial distributions of these damaging energy components are independent of blast direction.

Conclusions: The predictions reported herein will simplify efforts to correlate simulation predictions with clinical measures of TBI and aid in the development of protective headwear.

Keywords: Blast; mild traumatic brain injury; modelling; simulation.


Figures

Figure 1.
Figure 1.
Finite volume version of Head-Neck model. Top: front, rear, and left side views. Bottom: coronal, axial, and mid-sagittal cuts showing internal structure.
Figure 2.
Figure 2.
Stop-action plots of blast-induced pressure waves propagating through the head from the front (left), rear (center), and lateral (right) directions.
Figure 3.
Figure 3.
Plot of the conditions associated with the 1.35 MPa and 360 KPa (13.5 and 3.6 bars) blast pulses showing their proximity to the Bowen curve for threshold lung damage and its correction.
Figure 4.
Figure 4.
Pressure pulse defining a 360 KPa (3.6 bars) blast wave.
Figure 5.
Figure 5.
Time-lapse images of frontal blast exposure showing pressure in the mid-sagittal and supraorbital axial planes of the head-neck model. Upper pressure limit is 500 KPa. Regions without color are at or below the threshold pressure of 100 KPa (1 bar).
Figure 6.
Figure 6.
Time-lapse images of frontal blast exposure showing deviatoric shear stress levels in the mid-sagittal and supraorbital axial planes of the head-neck model.
Figure 7.
Figure 7.
Plots of maximum stress and energy in the mid-sagittal plane for a 360 KPa frontal blast. (a) Maximum compressive pressure (blue: 0.1 MPa; red: 1 MPa) and (b) corresponding isotropic compressive energy (blue: 1 J/m3; red: 300 J/m3). (c) Maximum tensile pressure (blue: 1 KPa; red: 200 KPa) and (d) corresponding isotropic tensile energy (blue: 1 J/m3; red: 200 J/m3). (e) Maximum deviatoric shear stress (blue: 0.1 KPa; red: 20 KPa) and (f) corresponding deviatoric energy (blue: 1 J/m3; red: 300 J/m3). Plot variable levels increase from blue (minimum), green, yellow, to red (maximum). Black denotes that the plot variable max limit has been exceeded.
Figure 8.
Figure 8.
Maximum Isotropic Compressive Energy for a 360 KPa blast. Top row: Frontal blast, mid-sagittal and axial planes; middle row: rear blast; bottom row: right side blast, mid-coronal and axial planes. Color scale: blue: 1 J/m3; red: 300 J/m3, black denotes that the plot limit has been exceeded. Positive energy is associated with compressive loading.
Figure 9.
Figure 9.
Maximum Isotropic Tensile Energy for a 360 KPa blast. Top row: Frontal blast, mid-sagittal and axial planes; middle row: rear blast; bottom row: right side blast, midcoronal and axial planes. Color scale: blue: −1 J/m3; red: −200 J/m3; black denotes that the plot limit has been exceeded. Negative energy is associated with tensile loading.
Figure 10.
Figure 10.
Maximum Deviatoric Energy for a 360 KPa blast. Top row: Frontal blast, mid-sagittal and axial planes; middle row: rear blast; bottom row: right side blast, mid-coronal and axial planes. Color scale: blue: 1 J/m3; red: 300 J/m3, black denotes that the plot limit has been exceeded. Deviatoric energy is always positive.
Figure 11.
Figure 11.
Lagrangian tracer locations. A: Tegmentum of Midbrain; B: Thalamus; C and D: anterior and posterior Corpus Callosum; E and F: left and right Internal Capsule.
Figure 12.
Figure 12.
Comparisons of isotropic energy as a function of blast direction for locations A through F in the brain.
Figure 13.
Figure 13.
Comparisons of deviatoric energy as a function of blast direction for locations A through F in the brain.
Figure 14.
Figure 14.
Normalized RMS difference of isotropic compressive and tensile energies and deviatoric energy as a function of blast direction for locations A through F in the brain. The dashed line at RMS Difference = 1 distinguishes dependence (>1) from independence (<1) on blast direction.

References

    1. Centers for Disease Control and Prevention. Traumatic brain injury in the US. Atlanta, GA, USA: National Center for Injury Prevention and Control; 2007. Available online at: http://www.cdc.gov/ncipc/pub-res/tbi_in_us_04/tbi_ed.htm, accessed July 27, 2012.
    1. Okie S. Traumatic brain injury in the war zone. The New England Journal of Medicine. 2005;352:2043–2047. - PubMed
    1. Defense and Veterans Brain Injury Center. DoD Worldwide Numbers for TBI | DVBIC. Silver Spring, MD, USA: Defense and Veterans Brain Injury Center. Available online at: http://www.dvbic.org/dod-worldwide-numbers-tbi, accessed July 5, 2012.
    1. Warden D. Military TBI during the Iraq and Afghanistan wars. Journal of Head Trauma Rehabilitation. 2006;21:398–402. - PubMed
    1. Fischer H. U.S. military casualty statistics: Operation New Dawn, operation Iraqi Freedom, and operation Enduring Freedom. Congressional Research Service. Washington, D.C., USA: Library of Congress; 1991. p 1–8. Available online at: https://opencrs.com/document/RS22452/, accessed July 5, 2012.

Publication types