. 2014 Apr 26:13:88.
doi: 10.1186/1476-4598-13-88.

WNT5A induces release of exosomes containing pro-angiogenic and immunosuppressive factors from malignant melanoma cells

Affiliations

WNT5A induces release of exosomes containing pro-angiogenic and immunosuppressive factors from malignant melanoma cells

Elin J Ekström et al. Mol Cancer. .

Abstract

Background: Wnt proteins are important for developmental processes and certain diseases. WNT5A is a non-canonical Wnt protein that previously has been shown to play a role in the progression of malignant melanoma. High expression of WNT5A in melanoma tumors correlates to formation of distant metastasis and poor prognosis. This has partly been described by the findings that WNT5A expression in melanoma cell lines increases migration and invasion.

Methods: Malignant melanoma cell lines were treated with rWNT5A or WNT5A siRNA, and mRNA versus protein levels of soluble mediators were measured using RT-PCR, cytokine bead array and ELISA. The induced signaling pathways were analyzed using inhibitors, Rho-GTPase pull down assays and western blot. Ultracentrifugation and electron microscopy was used to analyze microvesicles. Gene expression microarray data obtained from primary malignant melanomas was used to verify our data.

Results: We show that WNT5A signaling induces a Ca2+-dependent release of exosomes containing the immunomodulatory and pro-angiogenic proteins IL-6, VEGF and MMP2 in melanoma cells. The process was independent of the transcriptional machinery and depletion of WNT5A reduced the levels of the exosome-derived proteins. The WNT5A induced exosomal secretion was neither affected by Tetanus toxin nor Brefeldin A, but was blocked by the calcium chelator Bapta, inhibited by a dominant negative version of the small Rho-GTPase Cdc42 and was accompanied by cytoskeletal reorganization. Co-cultures of melanoma/endothelial cells showed that depletion of WNT5A in melanoma cells decreased endothelial cell branching, while stimulation of endothelial cells with isolated rWNT5A-induced melanoma exosomes increased endothelial cell branching in vitro. Finally, gene expression data analysis of primary malignant melanomas revealed a correlation between WNT5A expression and the angiogenesis marker ESAM.

Conclusions: These data indicate that WNT5A has a broader function on tumor progression and metastatic spread than previously known; by inducing exosome-release of immunomodulatory and pro-angiogenic factors that enhance the immunosuppressive and angiogenic capacity of the tumors thus rendering them more aggressive and more prone to metastasize.


Figures
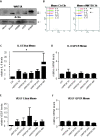
Figure 1
Figure 1
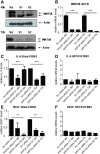
WNT5A increases secretion of IL-6, IL-8 and VEGF in cell culture supernatants. (A) Western blot of endogenous WNT5A protein expression in melanoma cell lines Mewo, SkMel28, A2058, A375 and HTB63. Anti-β-actin was used as loading control. Picture is representative of at least 3 experiments. (B) Mewo cells treated with carrier (0.1% BSA in PBS; Ctrl) or 0.2 μg/ml rWNT5A for 3 h. A set of inflammation cytokines were measured using BD Cytometric Bead Array (CBA) and both IL-6 and IL-8 were produced upon a short (3 h) rWNT5A stimulation. (C) IL-6 levels in Mewo cell culture supernatants were measured using IL-6 Elisa. Mewo cells were treated with 0.2 μg/ml rWNT5A or carrier for 3, 6, 12, 24 and 48 h and IL-6 in supernatants was measured. The bar graphs show average fold increase as compared to carrier (ctrl) for each time point indicated. The experiment was performed at least 4 times. Error bars represent SEM. (D) Cells from experiment 1C were used for IL-6 RT-QPCR. The experiment was performed at least 3 times. Error bars represent SD. (E) Supernatants from 1C were used to measure VEGF levels after WNT5A treatments. Error bars represent SEM. (F) Cells from 1C were used for VEGF RT-QPCR. The experiment was performed 3 times. Error bars represent SD. * = p <0.05 by ANOVA test.
Figure 2
Figure 2
WNT5A siRNA decreases IL-6 and VEGF secretion in cell culture supernatants. The efficiency of WNT5A siRNA transfection was determined using Western blot (A) and RT-QPCR (B) 48 h and 72 h after transfection. Anti-β-actin was used as loading control. Cell culture supernatants were analyzed for differences in IL-6 protein (C) and VEGF protein using Elisa (E). The experiment was performed at least 3 times. Error bars represent SEM. Differences in IL-6 (D) and VEGF (F) mRNA from the same experiments were analyzed using RT-QPCR. The experiment was performed at least 3 times. The bar graphs show average fold decrease as compared to scramble siRNA (ctrl) for each time point indicated. Error bars represent SD. *** = p <0.001, ** = p <0.01 by ANOVA test.
Figure 3
Figure 3
WNT5A induces a Ca2+- and Cdc42-dependent release of soluble mediators. (A) Mewo cells treated with rWNT5A for 3 h were paraffin embedded and stained with hematoxylin & eosin (HE). Scalebars = 10 μm. Arrows indicate differences in the cell cortex. (B) IL-6 Western blot (WB) detecting changes in intracellular IL-6 following cytokine release upon WNT5A treatment for 3 h. (C) Mewo cells treated with DMSO or Actinomycin D for 12 h together with rWnt5 or carrier. The bar graphs show average fold increase as compared to carrier (ctrl) for each time point and treatment indicated. Error bars represent SEM. n = 4. (D) Mewo cells were pre-treated with DMSO, the Ca2+-chelator Bapta-AM or PKA inhibitor H89 for 30 min prior to WNT5A treatment for 3 h. The bar graphs show average fold increase as compared to carrier (ctrl) for each time point and treatment indicated. Error bars represent SEM. n = 4. (E) Cdc42 is activated by WNT5A in Mewo cells. Western Blot of a GST-Pull down assay of active Cdc42, upon rWNT5A stimulation for 45 min. Controls are carrier (Ctrl) or rWNT3A for 45 min. (F) Transfection of Mewo cells with DN-Cdc42 or -Rac1 inhibits the WNT5A induced secretion of IL-6. Empty vector used as control. The data shown are ratios of rWNT5A treated (3 h)/untreated cells for each plasmid transfected and normalized against the empty vector control. n = 3. (G) Mewo cells were pre-treated with Tetanus toxin, TeNT, for 30 min prior to WNT5A treatment for 3 h or 24 h. The bar graphs show average fold increase as compared to carrier (ctrl) for each time point and treatment indicated. Error bars represent SD. n = 2. * = p <0.05 ** = p <0.01 by Student’s t-test. IL-6 levels in supernatants were detected using Elisa.
Figure 4
Figure 4
WNT5A induces MMP2 release in Mewo cells. (A) MMP2 levels in cell culture supernatants were measured using MMP2 Elisa. Mewo cells were treated with 0.2 μg/ml rWNT5A or carrier for 3, 6, 12, 24 and 48 h and IL-6 in supernatants was measured. The bar graphs show average fold increase as compared to carrier (ctrl) for each time point indicated. Error bars represent SEM. The experiment was performed at least 4 times. (B) Cells from experiment 4A were used for MMP2 RT-QPCR. Error bars represent SD. (C) Mewo cells were pre-treated with Tetanus toxin, TeNT, for 30 min prior to WNT5A treatment for 24 h. MMP2 levels in cell-culture supernatants were detected using Elisa. The bar graphs show average fold increase as compared to carrier (ctrl) for each time point and treatment indicated. Error bars represent SEM. n = 2. (D) Mewo cells were pre-treated with Brefeldin A, Bref A, for 30 min prior to WNT5A treatment for 3 h. MMP2 levels in cell-culture supernatants were detected using Elisa. The bar graphs show average fold increase as compared to carrier (ctrl) for each time point and treatment indicated. Error bars represent SEM. n = 4. * = p <0.05 ** = p <0.01 *** = p <0.001 by Student’s t-test.
Figure 5
Figure 5
Freeze/thawing releases the soluble mediators from the supernatants. (A) IL-6 levels as measured by Elisa in cell culture supernatants of Mewo cells that were treated with 0.2 μg/ml rWNT5A or carrier for 3 h and subsequently was freshly run on Elisa (4°C) or freeze/thawed for two cycles -80°C/4°C before analyses. The bar graphs show average fold increase as compared to carrier (ctrl) for each treatment indicated. Error bars represent SD. n = 2. (B) VEGF levels as measured by Elisa in cell culture supernatants of Mewo cells that were treated with 0.2 μg/ml rWNT5A or carrier for 3 h and subsequently was freshly run on Elisa (4°C) or freeze/thawed for two cycles -80°C/4°C before analyses. The bar graphs show average fold increase as compared to carrier (ctrl) for each treatment indicated. Error bars represent SD. n = 2. (C) MMP2 levels as measured by Elisa in cell culture supernatants of Mewo cells that were treated with 0.2 μg/ml rWNT5A or carrier for 3 h and subsequently was freshly run on Elisa (4°C) or freeze/thawed for two cycles -80°C/4°C before analyses. The bar graphs show average fold increase as compared to carrier (ctrl) for each treatment indicated. Error bars represent SD. n = 2. * = p <0.05; *** = p <0.001 by Student’s t-test.
Figure 6
Figure 6
WNT5A induces release of exosomes that contain solube mediators. (A) Electronmicroscopic picture of isolated exosome fraction from supernatant of Mewo cells treated with 0.2 μg/ml rWNT5A for 3 h. (B) Western blot of isolated exosomes from supernatant of Mewo cell stimulated with 0.2 μg/ml rWNT5A, carrier or 0.1 ng/ml rWNT3A for 3 h. GAPDH (upper), CD63 (center) and Rab5b (lower). (C) Quantitative Exosome Elisa (ExoELISA) of isolated exosome fraction from Mewo cells transfected with pcDNA3 or CA-Cdc42. The bar graphs show the relative increase of exosomes produced in CA-Cdc42 transfected as compared to pcDNA3 transfected Mewo cells. Error bars represent SEM. n = 5. * = p <0.05 by Student’s t-test. (D) IL-6 or (E) MMP2 levels as measured by Elisa of frozen exosome fractions isolated from supernatant of Mewo cells that were treated with 0.2 μg/ml rWNT5A, carrier or 0.1 ng/ml rWNT3A for 3 h. The low protein yield in the isolated exosome fractions might explain the higher relative background level in the control as compared to IL-6 measured in supernatant. The bar graphs show average fold increase as compared to carrier (ctrl) for each treatment indicated. Error bars represent SD. n = 3. * = p <0.05, ** = p <0.01 by Student’s t-test.
Figure 7
Figure 7
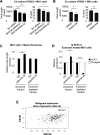
WNT5A affects angiogenic processes in malignant melanoma cells. (A) Quantification of total length of tubes (left), quantification of number of tubes (right), n = 4. Error bars represent SEM. * = p <0.05, ** = p <0.01 (B) MS1 cells grown together with HTB63 treated with DMSO or Bapta-AM, (left), total length of tubes, (right), number of tubes, n = 3. Error bars represent SEM. * = p <0.05 ** = p <0.01 by paired Student’s t-test. (C) MS1 cells that had been stimulated with exosomes isolated from carrier- or rWNT5A-treated Mewo cells, or with exosome-depleted supernatant from the corresponding samples, to analyze the relative total tube length induction, number of tubes, n = 6. Error bars represent SEM. ** = p <0.01 by paired Student’s t-test. (D) Q-PCR of mRNA from MS1 cells that had been stimulated with exosomes isolated from carrier- or rWNT5A-treated Mewo cells to analyze angiogenesis related genes using mouse specific primers. Both ALK1 (black bars) and Endoglin (white bars) expression was enhanced by rWNT5A induced exosomes (exosome fraction; left) whereas the exosome depleted supernatant fraction showed a loss of function as compared to total supernatant (exosome depleted fraction; right) (E) Correlation between WNT5A and the angiogenesis marker endothelial cell-selective adhesion molecule (ESAM) mRNA expression levels in a set of 223 primary malignant melanomas [24]. R = 0.31; Spearman’s rank test P = 7.7 × 10⁻⁷.

References

    1. Chien AJ, Conrad WH, Moon RT. A Wnt survival guide: from flies to human disease. J Invest Dermatol. 2009;129:1614–1627. doi: 10.1038/jid.2008.445. - DOI - PMC - PubMed
    1. Reischl J, Schwenke S, Beekman JM, Mrowietz U, Sturzebecher S, Heubach JF. Increased expression of Wnt5a in psoriatic plaques. J Invest Dermatol. 2007;127:163–169. doi: 10.1038/sj.jid.5700488. - DOI - PubMed
    1. Kikuchi A, Yamamoto H, Sato A, Matsumoto S. Wnt5a: its signalling, functions and implication in diseases. Acta Physiol. 2012;204:17–33. doi: 10.1111/j.1748-1716.2011.02294.x. - DOI - PubMed
    1. Hansen C, Howlin J, Tengholm A, Dyachok O, Vogel WF, Nairn AC, Greengard P, Andersson T. Wnt-5a-induced phosphorylation of DARPP-32 inhibits breast cancer cell migration in a CREB-dependent manner. J Biol Chem. 2009;284:27533–27543. doi: 10.1074/jbc.M109.048884. - DOI - PMC - PubMed
    1. Dejmek J, Safholm A, Kamp Nielsen C, Andersson T, Leandersson K. Wnt-5a/Ca2+-induced NFAT activity is counteracted by Wnt-5a/Yes-Cdc42-casein kinase 1alpha signaling in human mammary epithelial cells. Mol Cell Biol. 2006;26:6024–6036. doi: 10.1128/MCB.02354-05. - DOI - PMC - PubMed

Publication types

MeSH terms