. 2014 Apr 24;157(3):636-50.
doi: 10.1016/j.cell.2014.02.058.

Human CLP1 mutations alter tRNA biogenesis, affecting both peripheral and central nervous system function

Affiliations

Human CLP1 mutations alter tRNA biogenesis, affecting both peripheral and central nervous system function

Ender Karaca et al. Cell. .

Abstract

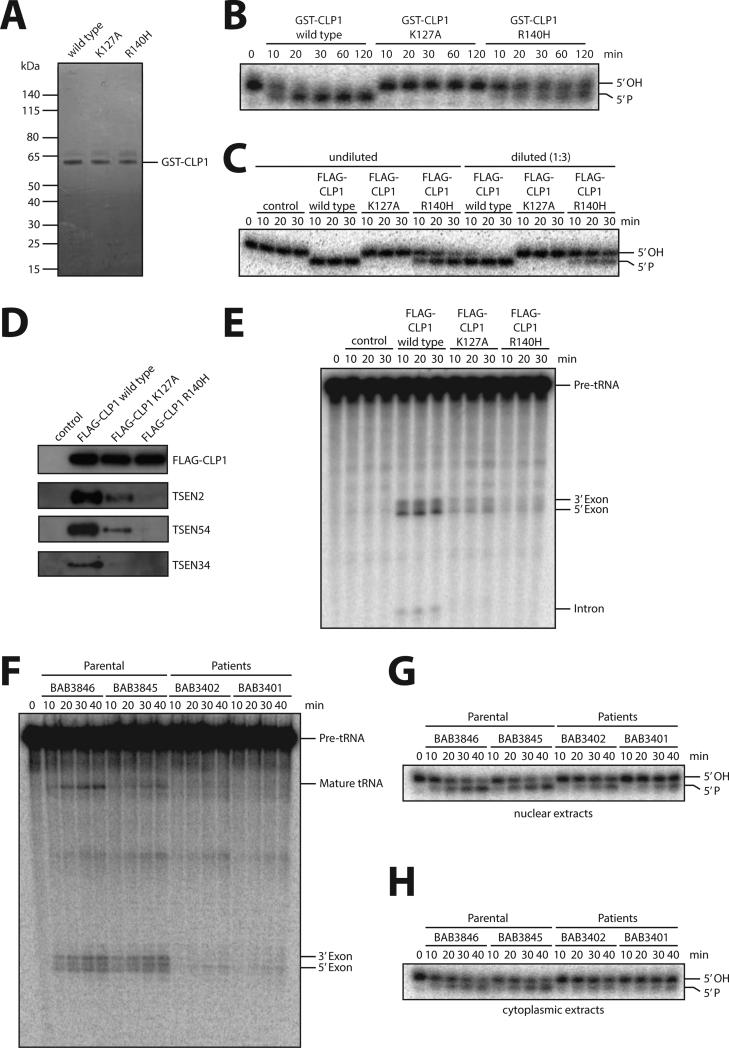
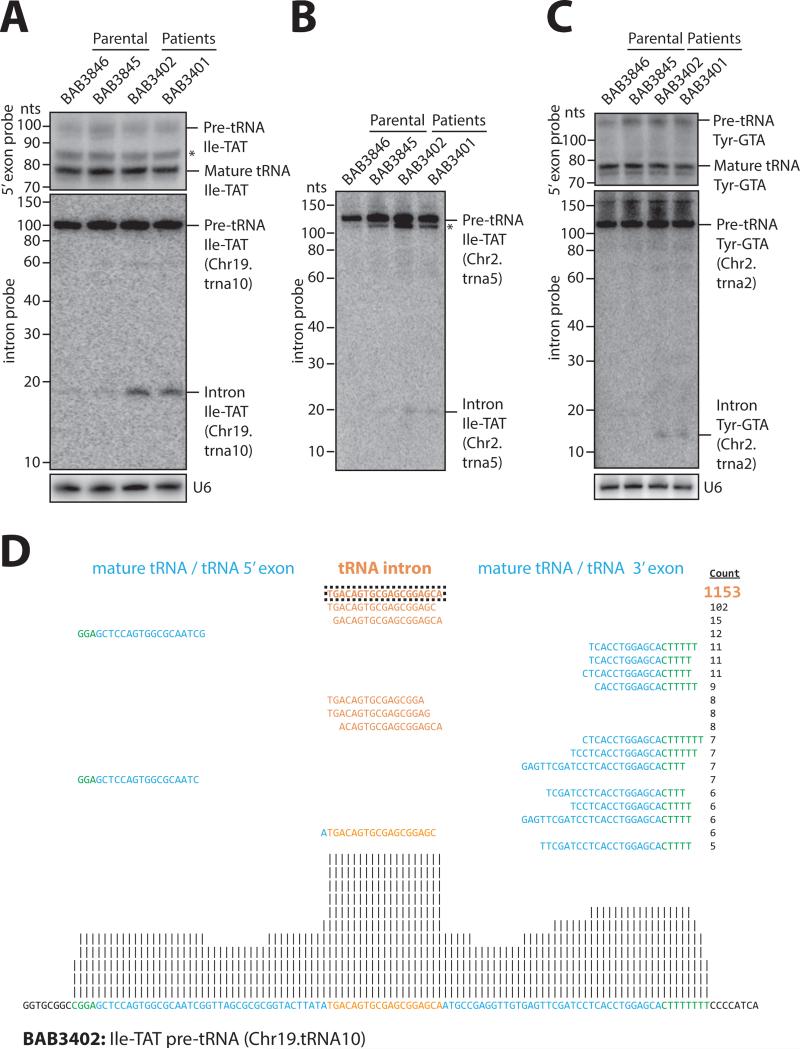
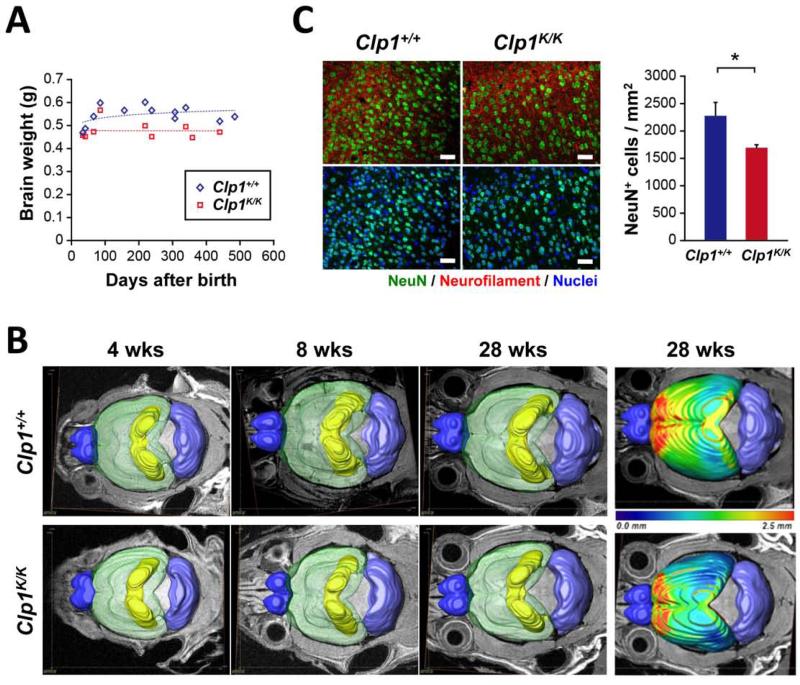
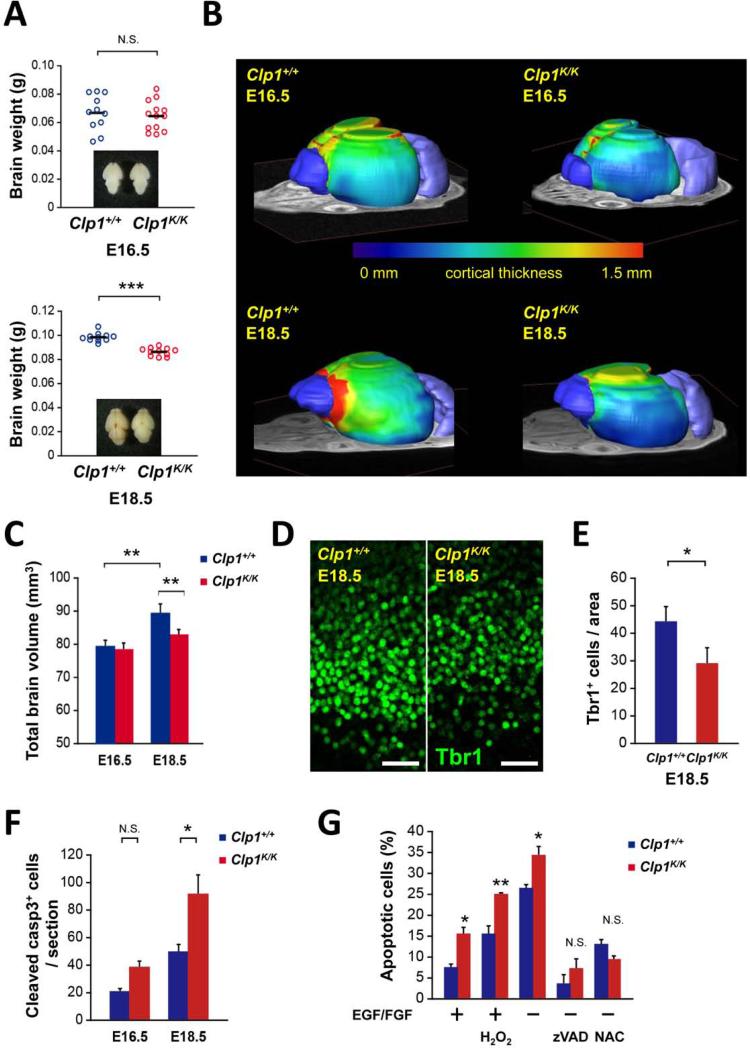
CLP1 is a RNA kinase involved in tRNA splicing. Recently, CLP1 kinase-dead mice were shown to display a neuromuscular disorder with loss of motor neurons and muscle paralysis. Human genome analyses now identified a CLP1 homozygous missense mutation (p.R140H) in five unrelated families, leading to a loss of CLP1 interaction with the tRNA splicing endonuclease (TSEN) complex, largely reduced pre-tRNA cleavage activity, and accumulation of linear tRNA introns. The affected individuals develop severe motor-sensory defects, cortical dysgenesis, and microcephaly. Mice carrying kinase-dead CLP1 also displayed microcephaly and reduced cortical brain volume due to the enhanced cell death of neuronal progenitors that is associated with reduced numbers of cortical neurons. Our data elucidate a neurological syndrome defined by CLP1 mutations that impair tRNA splicing. Reduction of a founder mutation to homozygosity illustrates the importance of rare variations in disease and supports the clan genomics hypothesis.


Figures

Figure 1
Figure 1. Clinical features and brain MRI images of patients
Pedigrees of five nuclear families and morphological features of patients showing similar dysmorphic facial features including high arched eyebrows and broad nasal roots. Mid-sagittal and axial views of cranial MRIs are also shown for each patient, revealing brain abnormalities of differing severities, including cortical dysgenesis marked by a simplified gyral pattern, particularly in the antero-temporal regions, shortening and thinning of the corpus callosum that is more prominent in the body segment, and vertical clivus in all patients. Also note focal volume loss of the cerebellar vermis in patient BAB4771 and mild cerebellar volume loss with thinning of the brain stem in patient BAB3520. See also Figures S1A and B.
Figure 2
Figure 2. Nerve conduction studies of patients with CLP1 mutations
Left. Results of sensory nerve conduction studies of the right median, right ulnar and right sural nerves. Velocity and amplitude values are shown for individual patients as percentages of the minimum normal value (100% - dotted line). Abnormal values are highlighted in red hues. Values that were not recordable despite being tested are indicated as “NR”. Patients that did not have a given nerve tested are blank. Center. Schematic showing the locations of the nerves tested. Right. Results of motor nerve conduction studies of the right median, right common peroneal and right tibial nerves. Patient numbers are indicated. See also Table S1.
Figure 3
Figure 3. Allele frequencies and modeling of the CLP1 mutation
(A) B-allele frequency plots for chromosome 11 in the five families. The eleven affected individuals share a common 11.5 Mb region of absence of heterozygosity (AOH) in the proximal long arm of the chromosome, including the CLP1 gene. The location of the gene is marked with a red line. The shared region of AOH extends across the centromere to the proximal short arm of the chromosome. AOH figure for family HOU1981 was created from whole exome data. (B) Interactome of CLP1 with subunits of the TSEN complex (green), mRNA splicing factors and components of the mRNA 3' end cleavage and polyadenylation complex (red), or genes involved in cell cycle control and cell death such as p53, ATM1, BRCA1, MDM1, or VRK1 (blue). (C) Sequence alignment of human CLP1 with CLP1 in other species. R140 is a conserved residue across all vertebrates. (D) Crystal structure of the yeast Clp1 proteins (Noble et al., 2007) illustrating its domain architecture. The highlighted Lys149 is positioned at the interface of the N-terminal and middle domains and is predicted to define the relative orientation of these domains. The zoomed-in image shows two glutamate residues of the N-terminal domain interacting with Lys149 that protrudes from the middle domain.
Figure 4
Figure 4. Biochemical studies on purified CLP1 R140H and patient fibroblasts
(A) Coomassie-blue staining of purified recombinant GST-tagged wild type CLP1, kinase-dead K127A CLP1, and the CLP1 R140H mutant protein. (B) RNA kinase assay using the indicated recombinant CLP1 versions showing that CLP1 R140H is still able to phosphorylate RNA. Recombinant proteins were incubated with an RNA duplex bearing a 5’-OH group and [32P]Cp 3’end-label at one strand for the indicated time points. RNA phosphorylation results in a migration shift after running the reaction products in a denaturing acryamide gel. Note that RNA phosphorylation is completely abolished by the CLP1 K127A mutation. The panel is a representation of two technical replicates. C) RNA kinase assay using protein complexes containing FLAG-CLP1 wild type, FLAG-CLP1 K127A and FLAG-CLP1 R140H affinity-purified from stably expressing HEK293 cells. HEK293 cells without expression of any tagged proteins served as a control. Assays were carried out with undiluted and 1:3-diluted eluates as indicated. (D) Western blotting for TSEN components interacting with affinity-purified FLAG-CLP1 wild type, FLAG-CLP1 K127A and FLAG-CLP1 R140H. (E) Pre-tRNA cleavage assay of affinity-purified FLAG-CLP1 wild type, FLAG-CLP1 K127A and FLAG-CLP1 R140H complexes incubated with an internally labeled intron-containing yeast pre-tRNAPhe. Pre-tRNA processing was monitored by denaturing gel electrophoresis. Panels C-E are representative examples of two replicates. (F) tRNA splicing assay of nuclear extracts of parental (BAB3845 and 3846) and patient (BAB3401 and 3402) fibroblasts incubated for the indicated time points with an internally labeled intron-containing yeast pre-tRNAPhe. Pre-tRNA processing was monitored by denaturing gel electrophoresis. (G, H) RNA kinase activity assay of nuclear (G) or cytoplasmic (H) extracts derived from parental and patient fibroblasts. Extracts were incubated with a 3’ end-labeled 5’ OH group containing RNA duplex for the indicated time points. RNA phosphorylation was monitored by denaturing gel electrophoresis. Panels F-H are representative examples of triplicate experiments. See also Figures S2A to C.
Figure 5
Figure 5. tRNA analysis of patient fibroblasts
(A-C) Northern blot analyses of RNA from parental and patient fibroblasts. A probe complementary to the 5’ exon of isoleucine-TAT and tyrosine-GTA tRNAs was used to detect mature and pre-tRNA species (top panels in [A] and [C]). Probes specifically directed against intron sequences were used to detect pre-tRNAs and tRNA introns of isoleucine-TAT Chr.19.tRNA10 ([A], middle panel) and Chr2.tRNA5 (B), and tyrosine-GTA Chr2.tRNA2 ([C], middle panel; human February 2009 [hg19] genome assembly). U6 snRNA served as loading control (bottom panels in [A] and [C]). Asterisks denote truncated pre-tRNA species. See also Figure S2D-G and Figure S3A-B. (D) Example for an alignment of RNA-seq reads of patient (BAB3402) fibroblasts against precursor tRNA isoleucine-TAT (Chr19.tRNA10). Total RNA was subjected to partial alkaline hydrolysis prior to cloning and sequencing. Reads were aligned against an in-house curated list of mature and pre-tRNAs. The mature tRNA (blue), the tRNA intron (orange), and the 5’ leader and 3’ trailer sequences (green) are shown. The frequency of each read is presented (count). All reads mapped uniquely to the identified positions. Upstream and downstream nucleotides with no sequencing evidence are shown in black. Vertical lines represent the relative frequency of binned, normalized read counts in log2 increments. See also Figure S3C to compare the accumulation of intron reads relative to parental (BAB3846) fibroblasts.
Figure 6
Figure 6. Microcephaly in adult kinase-defective Clp1 mice
(A) Scatter plots showing brain weights of Clp1+/+ and K127A mutant Clp1K/K mice on the viable CBA/J background. The ages of mice at the time of analysis are indicated; matching ages correspond to littermate pairs. (B) Surface renderings of bulbus olfactorius (dark blue), cortex (transparent green), hippocampus (yellow), and cerebellum (light blue) from MRI datasets of adult mice at 4, 8 weeks and 28 weeks old Clp1+/+ and Clp1K/K littermate mice. The right panels additionally show for 28 week old animals a pseudo-colour coded mapping of cortical thickness ranging from blue (0.0 mm) to increased thickness shown in red (2.5 mm). (C) Immunohistochemical analysis with antibodies against NeuN to detect neurons in the cortex of 12 weeks old littermate Clp1+/+ and Clp1K/K mice. Left panels show representative images of NeuN+ neurons (green). Sections are also stained for neurofilament and counterstained with Hoechst 33342 to visualize nuclei (blue). Scale bars: 50 μm. Right panel shows quantification (mean values +/− SEM) of NeuN+ neuron numbers in the neocortex. n = 6 mice per genotype. * P < 0.05. See also Figures S4 and S5.
Figure 7
Figure 7. Microcephaly in kinase-defective Clp1 embryos
(A) Brain weights and representative dorsal whole brain views (insets) of Clp1+/+ control and Clp1K/K E16.5 and E18.5 mouse embryos on the neonatal lethal C57BL/6 (B6) background. (B,C) 3D brain evaluations via MRI. (B) Representative visualizations of individual E16.5 and E18.5 Clp1+/+ and Clp1K/K mouse embryos on the B6 background. On top of an MRI slice iso-surface, 3D renderings are shown for the bulbus olfactorius (dark blue), cerebellum (light blue), and the cortex. The cortex is rainbow color-coded to illustrate the cortical thickness from 0 mm (blue) to 1.5 mm (red, more thick). (C) Quantification of brain volumes (mean values +/− SEM) determined via MRI. n = 8. (D) Representative images from immunohistochemical analysis with antibodies against Tbr1 to detect neurons in the cortical plate of Clp1+/+ control and Clp1K/K E18.5 embryos on the B6 background. Scale bars: 50 μm. (E) Quantification (mean values +/−SEM) of Tbr1+ neuron numbers in the neocortex of Clp1+/+ control and Clp1K/K E18.5 embryos on the B6 background. Of note, the area of Tbr1+ cells encompasses a region from the lateral ventricle to the brain surface (width of 300 pixels, ~ 100 μm). n = 8 mice per genotype. (F) Quantification (mean values +/− SEM) of cleaved Caspase 3+ cell numbers, indicative of apoptosis, in coronal sections of Clp1+/+ control and Clp1K/K E16.5 and E18.5 embryos on the B6 background. n = 3 mice per genotype. (G) Cell death of neuronal progenitors isolated from E14.5 Clp1+/+ and Clp1K/K embryos. Cells were cultured with (+) or without (−) EGF/FGF (each 20 ng/ml) and challenged with H2O2 (100 μM). Death was determined by assaying for cleaved Caspase 3 and blocked using zVAD (100 μM) or NAC (10 mM). Data are shown as mean values +/− SEM of triplicate cultures. * P < 0.05. ** P < 0.01. *** P < 0.001. N.S., not significant. See also Figures S6 and S7.

References

    1. Adzhubei IA, Schmidt S, Peshkin L, Ramensky VE, Gerasimova A, Bork P, Kondrashov AS, Sunyaev SR. A method and server for predicting damaging missense mutations. Nat Methods. 2010;7:248–249. - PMC - PubMed
    1. Antonellis A, Ellsworth RE, Sambuughin N, Puls I, Abel A, Lee-Lin SQ, Jordanova A, Kremensky I, Christodoulou K, Middleton LT, et al. Glycyl tRNA synthetase mutations in Charcot-Marie-Tooth disease type 2D and distal spinal muscular atrophy type V. Am J Hum Genet. 2003;72:1293–1299. - PMC - PubMed
    1. Bayat V, Thiffault I, Jaiswal M, Tetreault M, Donti T, Sasarman F, Bernard G, Demers-Lamarche J, Dicaire MJ, Mathieu J, et al. Mutations in the mitochondrial methionyl-tRNA synthetase cause a neurodegenerative phenotype in flies and a recessive ataxia (ARSAL) in humans. PLoS Biol. 2012;10:e1001288. - PMC - PubMed
    1. Bromberg Y, Yachdav G, Rost B. SNAP predicts effect of mutations on protein function. Bioinformatics. 2008;24:2397–2398. - PMC - PubMed
    1. Budde BS, Namavar Y, Barth PG, Poll-The BT, Nurnberg G, Becker C, van Ruissen F, Weterman MA, Fluiter K, te Beek ET, et al. tRNA splicing endonuclease mutations cause pontocerebellar hypoplasia. Nat Genet. 2008;40:1113–1118. - PubMed

Publication types

MeSH terms

Associated data