. 2014 Apr 24;157(3):676-88.
doi: 10.1016/j.cell.2014.02.025.

Murine pheromone proteins constitute a context-dependent combinatorial code governing multiple social behaviors

Affiliations

Murine pheromone proteins constitute a context-dependent combinatorial code governing multiple social behaviors

Angeldeep W Kaur et al. Cell. .

Abstract

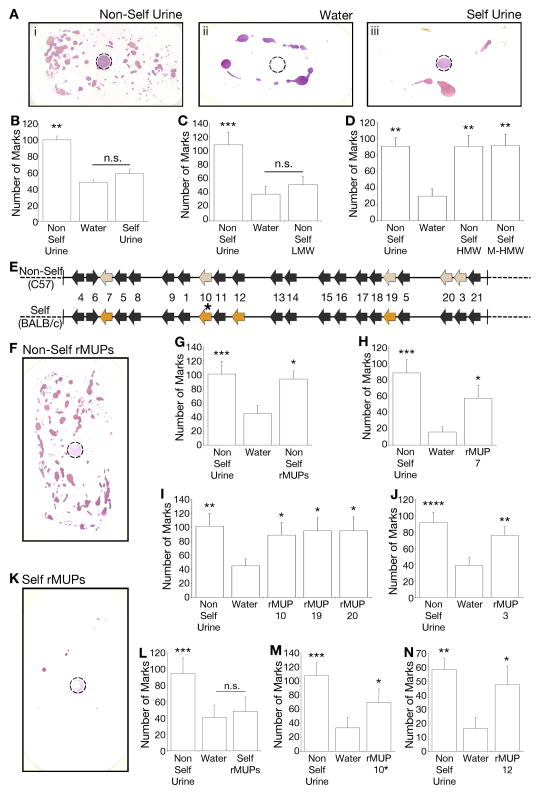
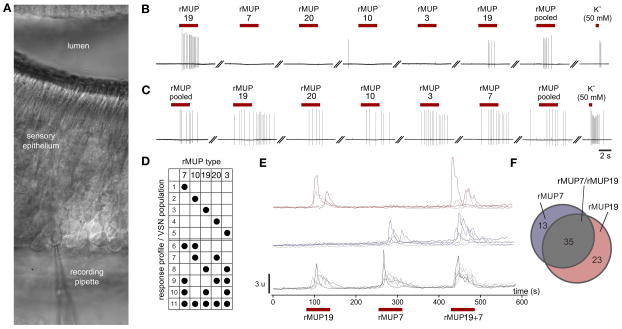
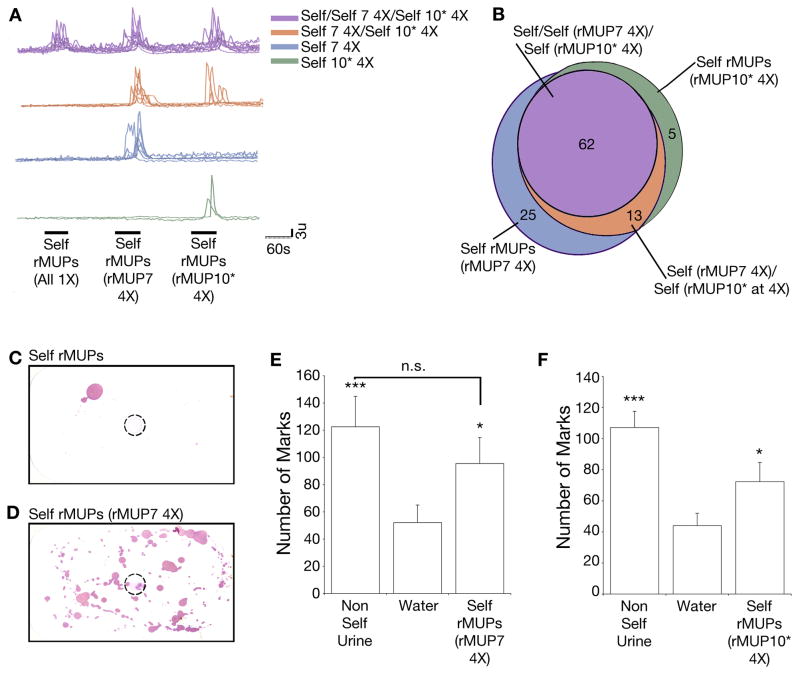
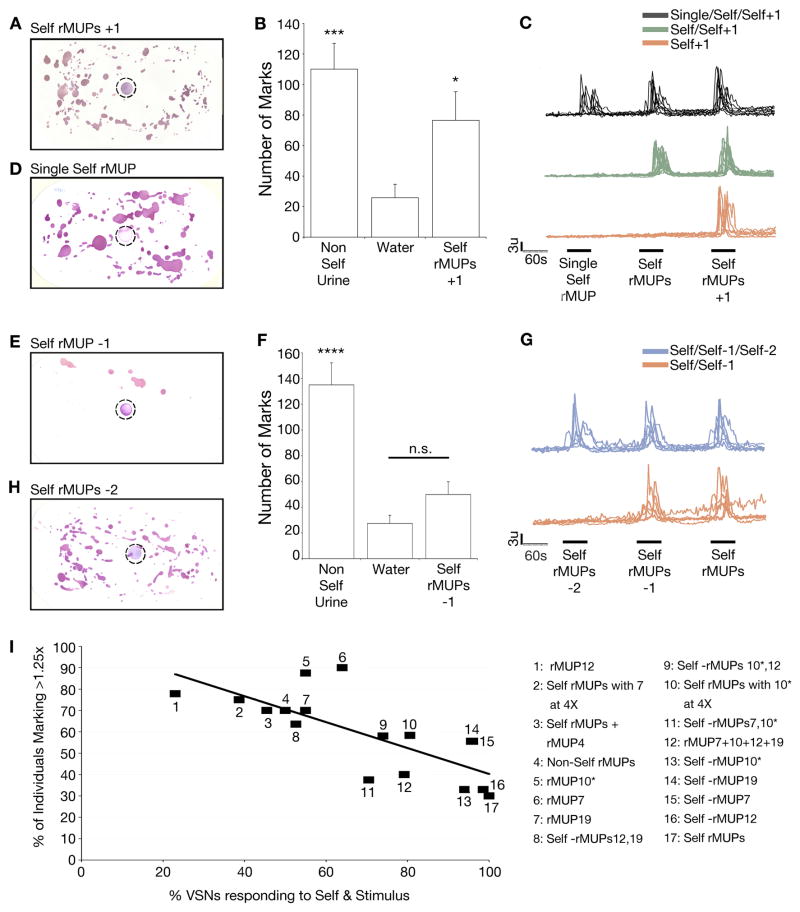
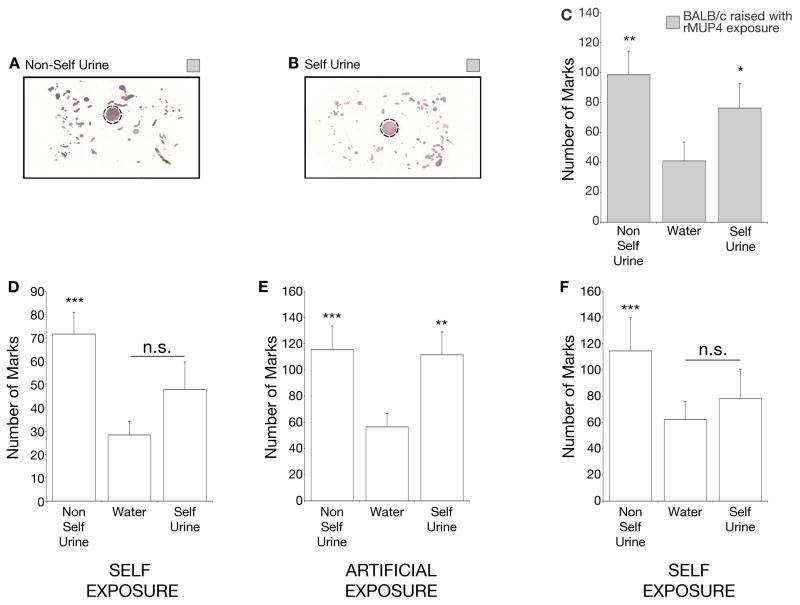
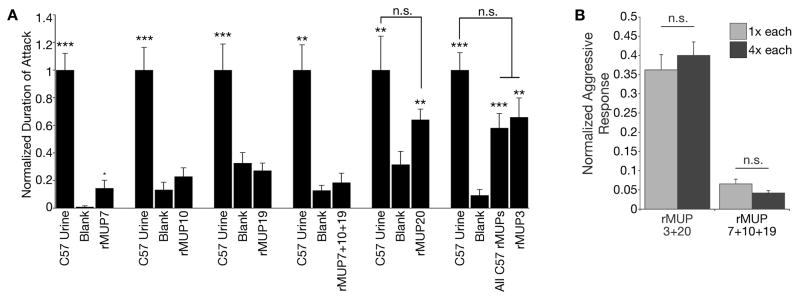
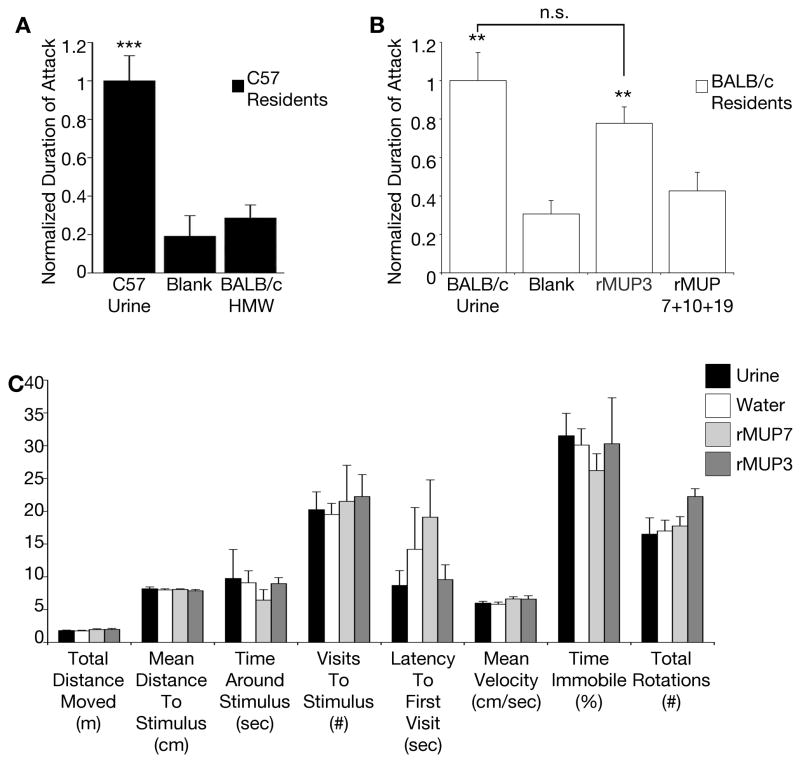
During social interactions, an individual's behavior is largely governed by the subset of signals emitted by others. Discrimination of "self" from "other" regulates the territorial urine countermarking behavior of mice. To identify the cues for this social discrimination and understand how they are interpreted, we designed an olfactory-dependent countermarking assay. We find major urinary proteins (MUPs) sufficient to elicit countermarking, and unlike other vomeronasal ligands that are detected by specifically tuned sensory neurons, MUPs are detected by a combinatorial strategy. A chemosensory signature of "self" that modulates behavior is developed via experience through exposure to a repertoire of MUPs. In contrast, aggression can be elicited by MUPs in an experience-independent but context-dependent manner. These findings reveal that individually emitted chemical cues can be interpreted based on their combinatorial permutation and relative ratios, and they can transmit both fixed and learned information to promote multiple behaviors.


Figures

Figure 1
Figure 1. MUPs are sufficient to elicit marking behavior
(A) Representative blots of urine marks deposited by BALB/c males in response to olfactory stimuli (dotted circle): non-self (C57BL/6J) urine (i), water (ii), or self (BALB/cByJ) urine (iii). (B–D) Quantification of urine marks to total urine (B), low molecular weight (LMW) fraction of non-self urine (C), or high molecular weight fraction with (HMW) or without (M-HMW) bound small molecules (D). (E) Genomic representation of Mup gene cluster. Colored arrows indicate genes expressed by non-self (C57BL/6J – top panel) or self (BALB/cByJ - bottom) strains. * indicates the Q159K MUP10 allelic variant present in BALB/cByJ, all other MUPs have the same amino acid sequences between the two strains. (F–G) Behavioral response to a mixture of non-self recombinant MUPs (rMUP3+rMUP7+rMUP10+rMUP19+rMUP20). (H–J) Quantification of behavioral responses to individual non-self rMUPs. (K–L) Behavioral response to a mixture of self-emitted rMUPs (rMUP7+rMUP10*+rMUP12+rMUP19); and (M–N) to individual self-emitted rMUPs (also see panels H & I). n=8–16. Mean + standard error of the mean (SEM). p-values determined by a repeated measures one-way ANOVA, with a Greenhouse-Geisser correction, followed by Bonferroni multiple comparisons test or by Friedman’s non-parametric test followed by Dunn’s multiple comparison test. ****p<0.0001, ***p<0.001, **p<0.01, *p<0.05. n.s. = non-significant. p-values determined by comparison to water. See also Figure S1.
Figure 2
Figure 2. VSNs utilize a combinatorial code to detect MUPs
(A) VNO slice preparation to analyze individual sensory neurons showing the location of the recording pipette in the basal layer. (B–C) Original ‘loose-seal’ traces from two representative VSNs repetitively responding to a single (B) or all (C) rMUPs. Red bars = stimulation. Stimuli were applied in random order, ISI = 60″. Recordings are representative of VSN population #3 and #11 (panel D), respectively. (D) Summary of 11 distinct populations of neurons observed during extracellular recordings. (E) Representative calcium transients imaged from dissociated VSNs sequentially stimulated with rMUP7 and rMUP19, which only differ by two amino acids (F56V & E140K), followed by a mixture of both MUPs. Colors indicate three distinct populations of VSNs based on response profile. Black bars indicate stimulus application. 3,767 cells imaged, sequentially exposed to all stimuli. (F) Venn diagram quantifying the 3 distinct populations of neurons observed to respond to the two MUP stimuli by calcium imaging, colors correspond to VSN population in panel (E). See also Figure S2.
Figure 3
Figure 3. Combinatorial code enables VSNs to detect relative ratios of MUPs
(A–B) Representative calcium transients from VSNs (A), quantified in (B). 2,515 cells imaged, sequentially exposed to self-rMUPs, self-rMUPs with rMUP7 at 4X, and self-rMUPs with rMUP10* at 4X. Colors indicate four distinct populations of VSNs based on response profile. Black bars indicate stimulus application. (C–D) Countermarking behavior in response to a spot (dotted circle) of self-rMUPs (C), or self-rMUPs where the ratio of an individual MUP (rMUP7) was increased 4-fold (4X) (D). (E–F) Quantification of behavioral response to self-rMUPs where the ratio of an individual MUP, rMUP7 (E) or rMUP10* (F), was increased 4-fold. n = 12. Mean + SEM. p-values determined by a repeated measures one-way ANOVA, with a Greenhouse-Geisser correction, followed by Bonferroni multiple comparisons test or by Friedman’s Test followed by Dunn’s multiple comparison test. See also Figure S3.
Figure 4
Figure 4. The identity and ratio of detected MUP ensemble modulates behavior
(A) Countermarking behavior in response to a spot (dotted circle) of self-rMUPs plus the additional novel rMUP4 (self rMUPs +1). (B) Quantification of behavioral response to self-rMUPs plus the additional novel rMUP4 (self rMUPs +1). n = 12. Mean + SEM. (C) Representative calcium transients from VSNs. 2,200 cells imaged, sequentially exposed to rMUP7, self rMUPs, and self rMUP+rMUP4. Colors indicate three distinct populations of VSNs based on response profile. (D) Countermarking behavior in response to a spot (dotted circle) of a single self-rMUP (rMUP7). (E–F) Countermarking behavior in response to a spot of self-rMUPs −1 (self-rMUPs without rMUP 7). (F) Summed marking response to every combination of three of the four self rMUPs (self rMUPs −1). n = 36. ****p<0.0001, ***p<0.001, **p<0.01, *p<0.05. n.s. = non-significant. p-values determined by comparison to water. (G) Representative calcium transients from VSNs. 3,893 cells imaged, sequentially exposed to self-rMUPs −2, self-rMUPs −1, and self-rMUPs. Colors indicate two distinct populations of VSNs based on response profile. Black bars indicate stimulus application. (H) Countermarking behavior in response to a spot of self-rMUPs −2 (self-rMUPs without rMUP10*and rMUP12). (I) An inverse relationship exists between countermarking behavior and the percentage of VSNs that respond both to the indicated stimulus and to self-rMUPs. Best linear fit, R2=0.56. See also Figure S4.
Figure 5
Figure 5. Signature of ‘self’ is based on experience
(A–B) Countermarking behavior of males raised with rMUP4 following exposure to a spot (dotted circle) of non-self urine (A) or self (BALB/c) urine (B). (C) Behavioral response of males raised with rMUP4 exposure shows marking to self (BALB/c) urine. n = 11. p-values determined by Friedman’s Test followed by Dunn’s multiple comparison test. (D–F) Behavioral response of adult males changes with odor experience. Males were raised among self odors (D), then exposed to non-self male soiled bedding (E), and returned to self odor environment (F). n = 7–15. p-values determined by Friedman’s Test followed by Dunn’s multiple comparison test. ****p<0.0001, ***p<0.001, **p<0.01, *p<0.05. n.s. = non-significant. p-values determined by comparison to water. See also Figure S5.
Figure 6
Figure 6. Only a subset of MUPs promotes aggression
(A) Only a subset of recombinant MUPs swabbed on castrate mice stimulate aggression in the resident-intruder assay. Black bars=C57 male residents, n = 6–51. Mean + SEM. p-values determined by Friedman’s Test followed by Dunn’s multiple comparison test. ****p<0.0001, ***p<0.001, **p<0.01, *p<0.05. n.s. = non-significant. p-values determined by comparison to water. (B) Aggression-promoting bioactivity of MUPs is not sensitive to ligand concentration. Response to negative control was subtracted from response to positive control and test stimulus. Response to test stimulus was then normalized to the response to positive control in order to compute the values presented. 1X = 5mg/ml of each protein in the mix, 4X = 20mg/ml of each protein in the mix. n = 12.
Figure 7
Figure 7. MUPs promote innate aggression
(A) Native BALB/c High Molecular Weight (HMW) fraction does not promote aggression in the resident-intruder assay. Black bars = C57BL/6J male residents. n = 5–20. (B) First detection of rMUP3 stimulates aggression in BALB/c males. White bars = BALB/c male residents. n = 12. Mean + SEM. p-values determined by ANOVA followed by Tukey-HSD post hoc analysis or by Kruskal-Wallis test. ****p<0.0001, ***p<0.001, **p<0.01, *p<0.05. n.s. = non-significant. (C) Locomotor behavior of test animals during odor-mediated countermarking assay as measured by tracking software. n = 4. All values mean + SEM. No significant differences were found by one-tailed ANOVA. See also Figure S6.

References

    1. Adams DB. Brain mechanisms of aggressive behavior: an updated review. Neuroscience and biobehavioral reviews. 2006;30:304–318. - PubMed
    1. Armstrong SD, Robertson DH, Cheetham SA, Hurst JL, Beynon RJ. Structural and functional differences in isoforms of mouse major urinary proteins: a male-specific protein that preferentially binds a male pheromone. Biochem J. 2005;391:343–350. - PMC - PubMed
    1. Bacchini A, Gaetani E, Cavaggioni A. Pheromone binding proteins of the mouse, Mus musculus. Experientia. 1992;48:419–421. - PubMed
    1. Beynon RJ, Hurst JL. Multiple roles of major urinary proteins in the house mouse, Mus domesticus. Biochemical Society transactions. 2003;31:142–146. - PubMed
    1. Beynon RJ, Hurst JL. Urinary proteins and the modulation of chemical scents in mice and rats. Peptides. 2004;25:1553–1563. - PubMed

Publication types

LinkOut - more resources