. 2014 Apr 27:15:50.
doi: 10.1186/1471-2156-15-50.

Effect of advanced intercrossing on genome structure and on the power to detect linked quantitative trait loci in a multi-parent population: a simulation study in rice

Affiliations

Effect of advanced intercrossing on genome structure and on the power to detect linked quantitative trait loci in a multi-parent population: a simulation study in rice

Eiji Yamamoto et al. BMC Genet. .

Abstract

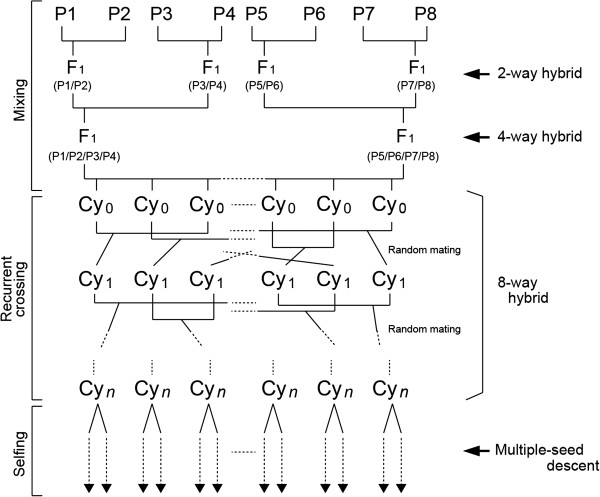
Background: In genetic analysis of agronomic traits, quantitative trait loci (QTLs) that control the same phenotype are often closely linked. Furthermore, many QTLs are localized in specific genomic regions (QTL clusters) that include naturally occurring allelic variations in different genes. Therefore, linkage among QTLs may complicate the detection of each individual QTL. This problem can be resolved by using populations that include many potential recombination sites. Recently, multi-parent populations have been developed and used for QTL analysis. However, their efficiency for detection of linked QTLs has not received attention. By using information on rice, we simulated the construction of a multi-parent population followed by cycles of recurrent crossing and inbreeding, and we investigated the resulting genome structure and its usefulness for detecting linked QTLs as a function of the number of cycles of recurrent crossing.

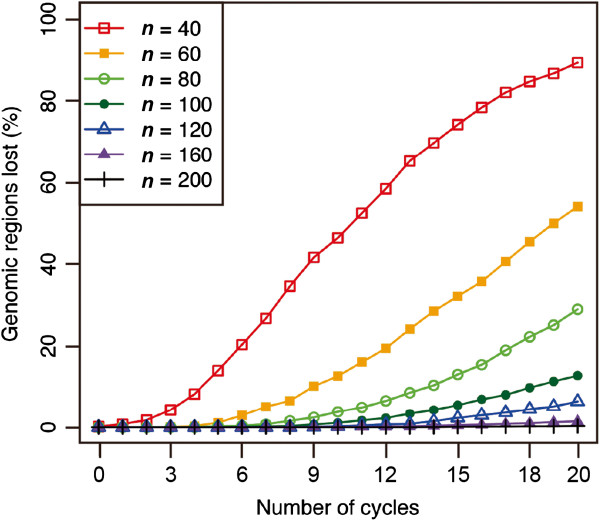
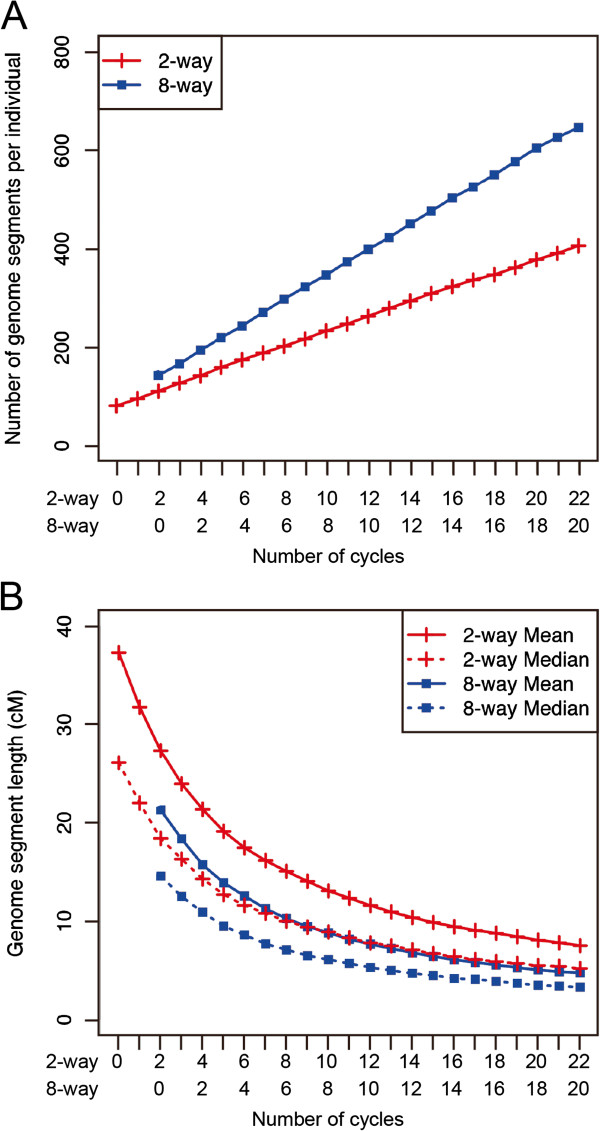
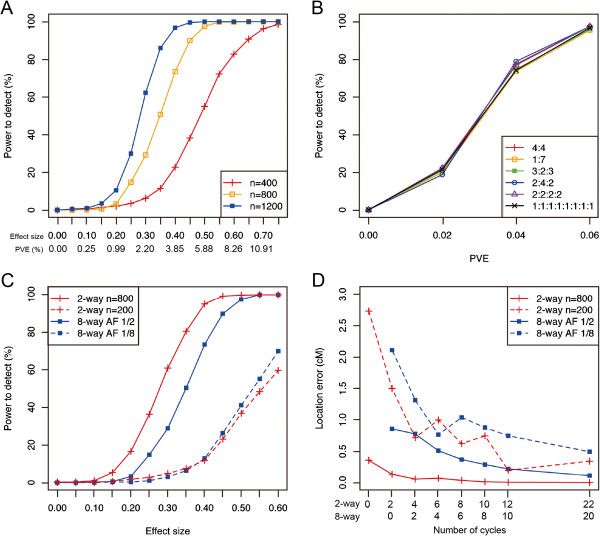
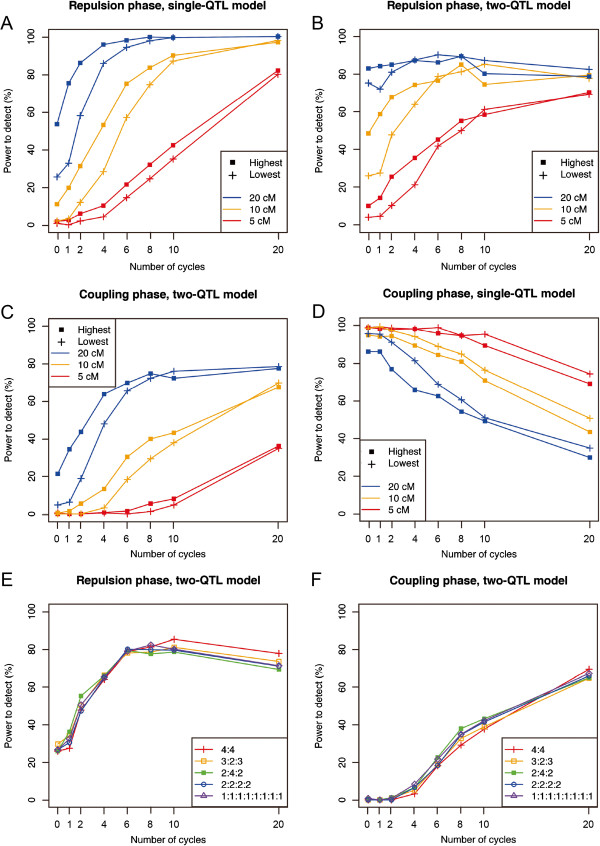
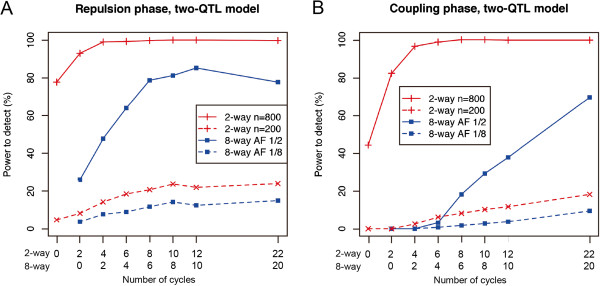
Results: The number of non-recombinant genome segments increased linearly with an increasing number of cycles. The mean and median lengths of the non-recombinant genome segments decreased dramatically during the first five to six cycles, then decreased more slowly during subsequent cycles. Without recurrent crossing, we found that there is a risk of missing QTLs that are linked in a repulsion phase, and a risk of identifying linked QTLs in a coupling phase as a single QTL, even when the population was derived from eight parental lines. In our simulation results, using fewer than two cycles of recurrent crossing produced results that differed little from the results with zero cycles, whereas using more than six cycles dramatically improved the power under most of the conditions that we simulated.

Conclusion: Our results indicated that even with a population derived from eight parental lines, fewer than two cycles of crossing does not improve the power to detect linked QTLs. However, using six cycles dramatically improved the power, suggesting that advanced intercrossing can help to resolve the problems that result from linkage among QTLs.


Figures

Figure 1
Figure 1
Strategy used for the production of a rice eight-way IRIP. Cycles 0 and 1 represent IRIPs derived from no cycles or one cycle of recurrent crossing, respectively. Cyn, number of cycles.
Figure 2
Figure 2
Frequency of genetic drift during the recurrent crossing stage. The degree of genetic drift was represented by the percentage of the total genomic regions in which the genome derived from one or more of the parental lines had been lost. n represents the population size.
Figure 3
Figure 3
Relationship between the number of cycles and the genome structure in a rice two-way IRIP (n= 200) and an eight-way IRIP (n= 800). Plots for the eight-way IRIP started two cycles behind the two-way IRIP to match the total number of outcrossings (i.e., the eight-way population requires two additional outcrossings to reach the cycle 0 stage). (A) Total number of genome segments per individual. (B) Mean and median genome segment lengths.
Figure 4
Figure 4
Power to detect single additive QTLs in the rice eight-way IRIPs. Detailed conditions of this experiment are described in Table  2. (A) Power to detect a single additive QTL in the rice eight-way IRIPs. Values are the result of 400 simulations. (B) Comparison of the power to detect a single additive QTL between the bi-allelic case and the multi-allelic cases. Values are the result of 400 simulations. (C) Comparison of the power to detect a single additive QTL between the two-way and eight-way IRIPs. Values are the result of 400 simulations. (D) The location error for the detected QTLs. The location error equals the distance between the position of the maximum P-value and the true QTL position. Values are the result of 1000 simulations.
Figure 5
Figure 5
Relationship between the number of cycles and the power to detect linked QTLs. Data are the results for the rice eight-way IRIPs (n = 800). Values are the result of 400 simulations, and 5, 10, and 20 cM represent the distance between the QTLs. Detailed conditions of this experiment are described in Table  3. (A) Power to detect QTLs in the repulsion phase by using the single-QTL model. (B) Power to detect QTLs in the repulsion phase by using the two-QTL model. (C) Power to separate QTLs in the coupling phase by using the two-QTL model. (D) Power to detect QTLs with a small effect in the coupling phase. (E) Comparison of the power to separate QTLs in the repulsion phase between the bi-allelic and multi-allelic cases. (F) Comparison of the power to separate QTLs in the coupling phase between the bi-allelic and multi-allelic cases.
Figure 6
Figure 6
Comparison of the power to separate linked QTLs between the two-way and eight-way IRIPs. Plots for the eight-way population started two cycles behind the two-way IRIP to match the number of outcrossings (i.e., the eight-way population requires two additional outcrossings to reach the cycle 0 stage). Values are the result of 400 simulations. Detailed conditions of this experiment are described in Table  3. (A) Power to detect QTLs in the repulsion phase by using the two-QTL model. (B) Power to separate QTLs in the coupling phase by using the two-QTL model.

References

    1. Huang X, Wei X, Sang T, Zhao Q, Feng Q, Zhao Y, Li C, Zhu C, Lu T, Zhang Z, Li M, Fan D, Guo Y, Wang A, Wang L, Deng L, Li W, Lu Y, Weng Q, Liu K, Huang T, Zhou T, Jing Y, Li W, Lin Z, Buckler ES, Qian Q, Zhang QF, Li J, Han B. Genome-wide association studies of 14 agronomic traits in rice landraces. Nat Genet. 2010;42:961–967. doi: 10.1038/ng.695. - DOI - PubMed
    1. Huang X, Zhao Y, Wei X, Li C, Wang A, Zhao Q, Li W, Guo Y, Deng L, Zhu C, Fan D, Lu Y, Weng Q, Liu K, Zhou T, Jing Y, Si L, Dong G, Huang T, Lu T, Feng Q, Qian Q, Li J, Han B. Genome-wide association study of flowering time and grain yield traits in a worldwide collection of rice germplasm. Nat Genet. 2011;44:32–39. doi: 10.1038/ng.1018. - DOI - PubMed
    1. Iwata H, Uga Y, Yoshioka Y, Ebana K, Hayashi T. Bayesian association mapping of multiple quantitative trait loci and its application to the analysis of genetic variation among Oryza sativa L. germplasms. Theor Appl Genet. 2007;114:1437–1449. doi: 10.1007/s00122-007-0529-x. - DOI - PubMed
    1. Iwata H, Ebana K, Fukuoka S, Jannink JL, Hayashi T. Bayesian multilocus association mapping on ordinal and censored traits and its application to the analysis of genetic variation among Oryza sativa L. germplasms. Theor Appl Genet. 2009;118:865–880. doi: 10.1007/s00122-008-0945-6. - DOI - PubMed
    1. Zhao K, Tung CW, Eizenga GC, Wright MH, Ali ML, Price AH, Norton GJ, Islam MR, Reynolds A, Mezey J, McClung AM, Bustamante CD, McCouch SR. Genome-wide association mapping reveals a rich genetic architecture of complex traits in Oryza sativa. Nat Commun. 2012;2:467. - PMC - PubMed

Publication types

LinkOut - more resources