. 2014 May 8;7(3):705-14.
doi: 10.1016/j.celrep.2014.03.057. Epub 2014 Apr 24.

Constant growth rate can be supported by decreasing energy flux and increasing aerobic glycolysis

Affiliations

Constant growth rate can be supported by decreasing energy flux and increasing aerobic glycolysis

Nikolai Slavov et al. Cell Rep. .

Abstract

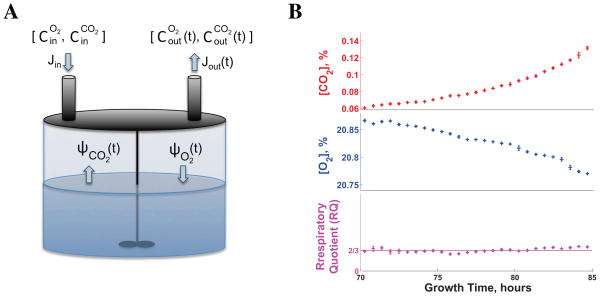
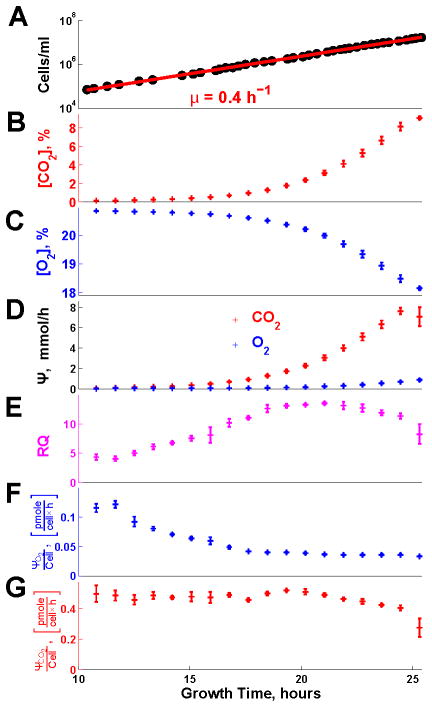
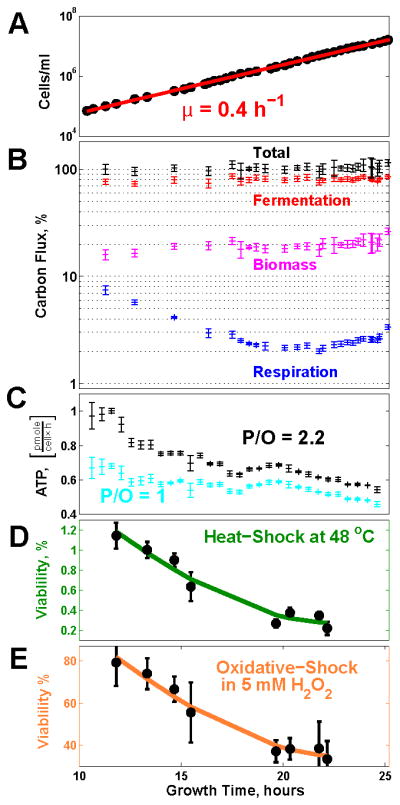
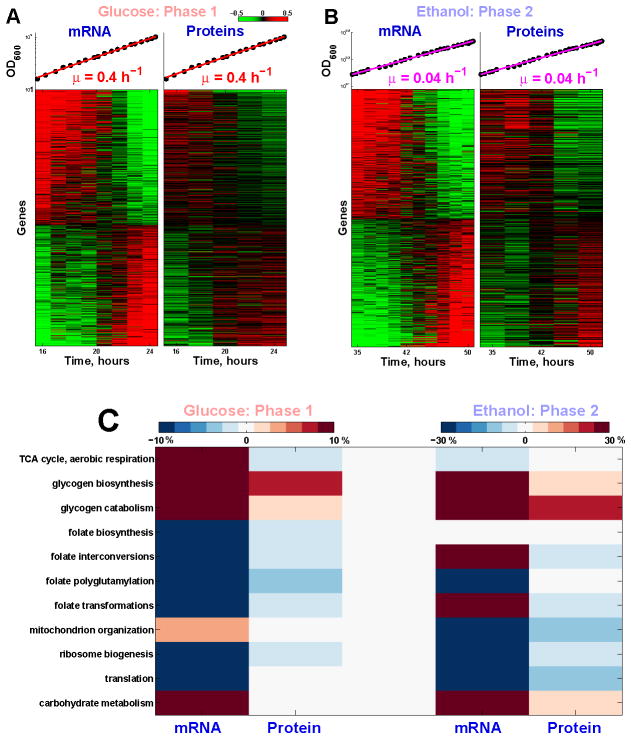
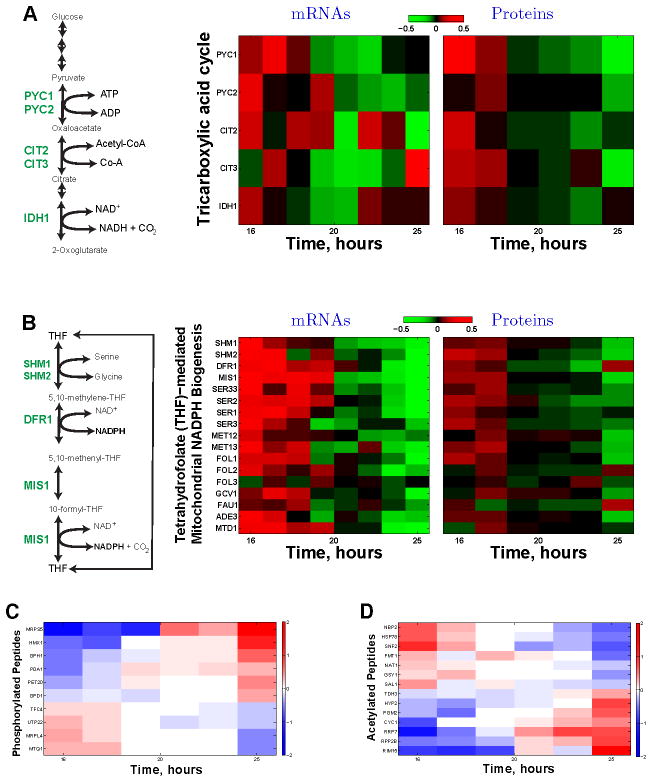
Fermenting glucose in the presence of enough oxygen to support respiration, known as aerobic glycolysis, is believed to maximize growth rate. We observed increasing aerobic glycolysis during exponential growth, suggesting additional physiological roles for aerobic glycolysis. We investigated such roles in yeast batch cultures by quantifying O2 consumption, CO2 production, amino acids, mRNAs, proteins, posttranslational modifications, and stress sensitivity in the course of nine doublings at constant rate. During this course, the cells support a constant biomass-production rate with decreasing rates of respiration and ATP production but also decrease their stress resistance. As the respiration rate decreases, so do the levels of enzymes catalyzing rate-determining reactions of the tricarboxylic-acid cycle (providing NADH for respiration) and of mitochondrial folate-mediated NADPH production (required for oxidative defense). The findings demonstrate that exponential growth can represent not a single metabolic/physiological state but a continuum of changing states and that aerobic glycolysis can reduce the energy demands associated with respiratory metabolism and stress survival.


Figures

Figure 1
Figure 1. Experimental Design for Precision Measurements of O2 Uptake and CO2 Production in Time
(A) A conceptual schematic of the method used for precision measurements of O2 and CO2 fluxes in low–density yeast cultures; Cin are the concentrations of gases in the air entering the reactor at rate Jin, and the Cout are the concentrations of gases existing the reactor at rate Jout. (B) The respiratory quotient (RQ) estimated from O2 and CO2 concentrations measured in a low–density yeast culture growing on ethanol as a sole source of carbon and energy equals the RQ estimate from mass-conservation (2/3); the culture was inoculated at a density of 1000 cells/ml and measurements began 70 hours after inoculation, when the cultured had reached a density of about 105 cells/ml. Error bars denote standard deviations. See Figure S1 and the Supplemental Information for more control experiments and details. See also Figure S1.
Figure 2
Figure 2. Rates of Respiration and Fermentation Evolve Continuously During Batch Growth at a Constant Growth Rate
(A) Cell density (single cells per ml) during exponential growth on glucose as a sole source of carbon and energy. (B) The levels of O2 in the exhaust gas were measured continuously (every second) with a ZrO2 electrochemical cell. (C) The levels of CO2 in the exhaust gas were measured continuously (every second) with infra red spectroscopy. (D) Fluxes of O2 uptake ΨO2 and CO2 production ΨCO2 estimated from the data in (A) and (B) and eqn. 1–2; see Supplemental Information for details. (E) Respiratory quotient (RQ), defined as the ratio of ΨCO2 to ΨO2. (F) Rate of O2 uptake per cell. (G) Rate of CO2 production per cell. In all panels, error bars denote standard deviations. See also Figure S2.
Figure 3
Figure 3. The Fraction of Glucose Carbon Flux Incorporated into Biomass and the Sensitivity to Stress Increase While the Growth Rate Remains Constant
(A) Exponential increase in the number of cells indicates a constant doubling period. (B) The fraction of carbon flux from glucose (moles of carbon per hour) directed into the major metabolic pathways, as computed from the gas and biomass data, evolves continuously; the sum of the fluxes through these pathways (total) can account, at all time points, for the carbon intake flux from glucose; see Supplemental Information. (C) The ATP flux was estimated from the fluxes of CO2 and O2 in Figure 2E–F for low efficiency of oxidative phosphorylation, 1 ATP per oxygen atom (16 ATPs/glucose), and for high efficiency, 2.2 ATPs per oxygen atom (30.4 ATPs/glucose). (D) The ability of the cells to survive heat shock (48°C for 10 min) declines during the exponential growth phase. Stress sensitivity was quantified by counting colony-forming units (CFU) on YPD plates. (E) The ability of the cells to survive oxidative-shock (5mM H2O2 for 10 min) declines during the exponential growth phase. In all panels, error bars denote standard deviations. See also Figure S3.
Figure 4
Figure 4. Global Remodeling of mRNA and Protein Regulation during Batch Growth at a Constant Growth Rate
(A) Thousands of mRNAs and proteins (FDR< 1%) either increase or decrease monotonically in abundance during the first phase of exponential growth our culture. Levels are reported on a log2 scale with a 2 fold dynamic range. The mRNA and protein levels were measured in independent (biological replica) cultures and their correlation reflects the reproducibility of the measurements. (B) Thousands of mRNAs and proteins (FDR< 1%) either increase or decrease monotonically in abundance during the second phase of exponential growth our culture. (C) Metabolic pathways that show statistically significant dynamics (FDR < 1%) during the two phases of exponential growth; see Supplemental Information. The magnitude of change for each gene set is quantified as the average percent change in the level of its genes per doubling period of the cells. See also Figure S4.
Figure 5
Figure 5. Dynamics of Enzymes and Post-translational Modifications Regulating Respiratory Metabolism at a Constant Growth Rate
(A) The levels of enzymes (and their corresponding mRNAs) catalyzing the first rate-determining reactions of the tricarboxylic acid (TCA) cycle decline, parallel to the decreased oxygen consumption (Figure 2F), during the first exponential growth phase. These enzymes include the pyruvate carboxylases (Pyc1p and Pyc2p), citrate synthetases (Cit1p and Cit2p), and the isocitrate dehydrogenase (Idh1p). See Figure 4 and Figure S4 for other related pathways that also show statistically significant declines. The data are displayed on a log2 scale with 2 fold dynamical range. (B) The levels of enzymes (and their corresponding mRNAs) catalyzing the tetrahydrofolate (THF)-mediated mitochondrial NADPH biogenesis decline, parallel to the decreased oxygen consumption (Figure 2F), during the first exponential growth phase. These include all enzymes (Ser3p, Ser33p, Ser1p, Ser2p) catalyzing the serine biosynthesis from 3-phosphoglycerate, the hydroxymethyltransferases (Shm1p, Shm2p) and the mitochondrial NADPH synthetases: the dihydrofolate reductase (Dfr1p) and the mitochondrial C1–tetrahydrofolate synthase (Mis1p). See Figure 4 and Figure S4 for other related pathways that also show statistically significant declines. The data are displayed on a log2 scale with 2 fold dynamical range. (C) Levels of phosphorylated peptides change during exponential growth at a constant rate. (D) Levels of acetylated peptides change during exponential growth at a constant rate. The levels of peptides with post-translational modifications are shown on a log2 scale, and the corresponding proteins are marked on the y–axis. See also Figure S5.

References

    1. Appling DR. Compartmentation of folate-mediated one-carbon metabolism in eukaryotes. The FASEB journal. 1991;5:2645–2651. - PubMed
    1. Bauer DE, Harris MH, Plas DR, Lum JJ, Hammerman PS, Rathmell JC, Riley JL, Thompson CB. Cytokine stimulation of aerobic glycolysis in hematopoietic cells exceeds proliferative demand. The FASEB journal. 2004;18:1303–1305. - PMC - PubMed
    1. Belle A, Tanay A, Bitincka L, Shamir R, OShea EK. Quantification of protein half-lives in the budding yeast proteome. Proceedings of the National Academy of Sciences. 2006;103:13004–13009. - PMC - PubMed
    1. Boer VM, Amini S, Botstein D. Influence of genotype and nutrition on survival and metabolism of starving yeast. Proceedings of the National Academy of Sciences. 2008;105:6930–6935. - PMC - PubMed
    1. Boisvert F-M, Ahmad Y, Gierliński M, Charrière F, Lamont D, Scott M, Barton G, Lamond AI. A quantitative spatial proteomics analysis of proteome turnover in human cells. Molecular & Cellular Proteomics. 2012:11. - PMC - PubMed

Publication types

MeSH terms

Associated data