. 2014 May 19;24(10):1062-70.
doi: 10.1016/j.cub.2014.03.051. Epub 2014 Apr 24.

Candidate neural substrates for off-edge motion detection in Drosophila

Affiliations

Candidate neural substrates for off-edge motion detection in Drosophila

Kazunori Shinomiya et al. Curr Biol. .

Abstract

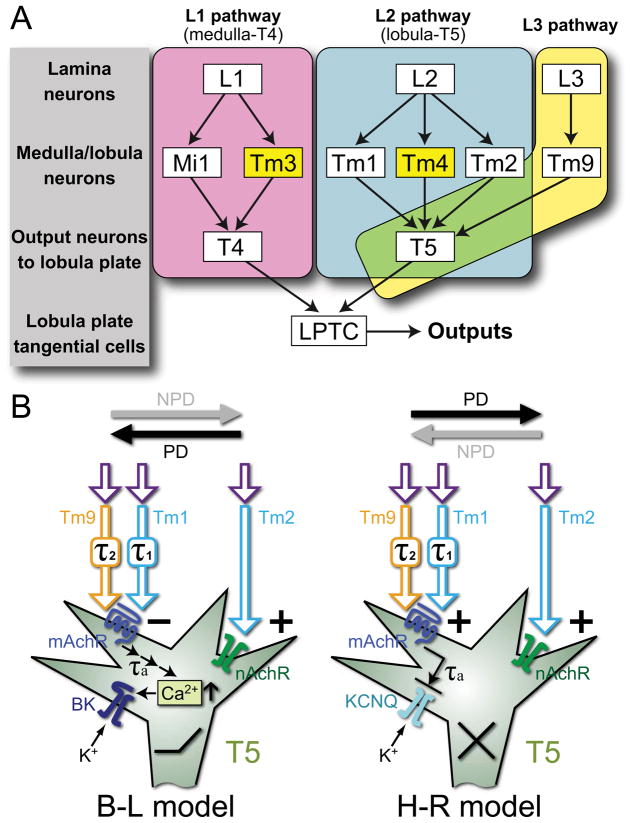
Background: In the fly's visual motion pathways, two cell types-T4 and T5-are the first known relay neurons to signal small-field direction-selective motion responses [1]. These cells then feed into large tangential cells that signal wide-field motion. Recent studies have identified two types of columnar neurons in the second neuropil, or medulla, that relay input to T4 from L1, the ON-channel neuron in the first neuropil, or lamina, thus providing a candidate substrate for the elementary motion detector (EMD) [2]. Interneurons relaying the OFF channel from L1's partner, L2, to T5 are so far not known, however.

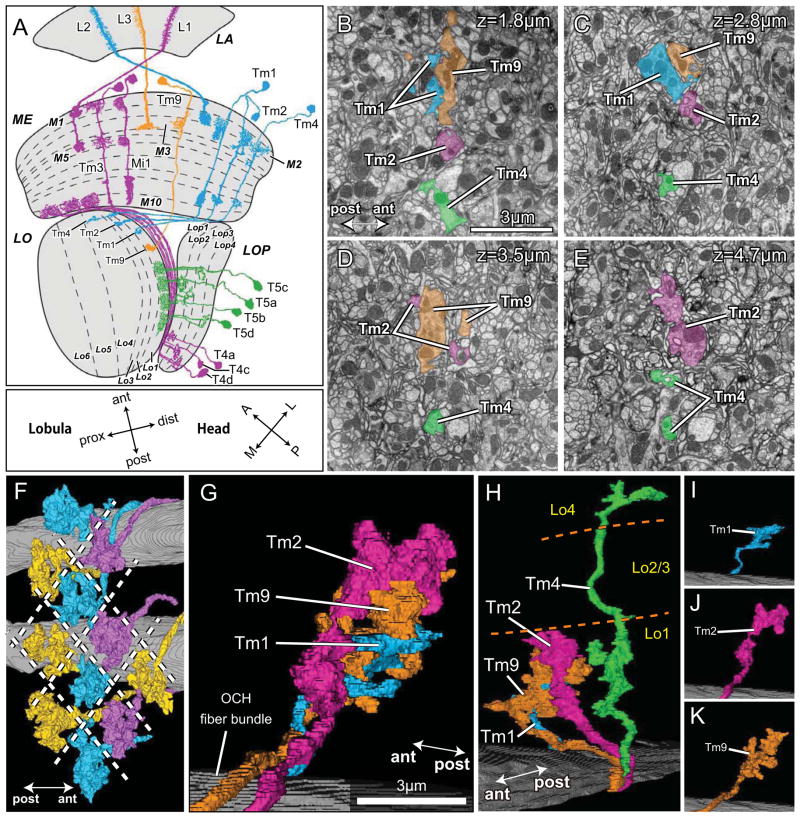
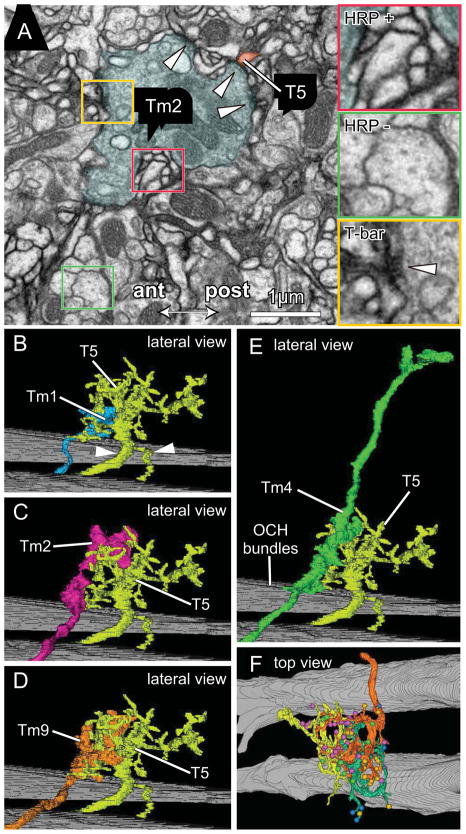
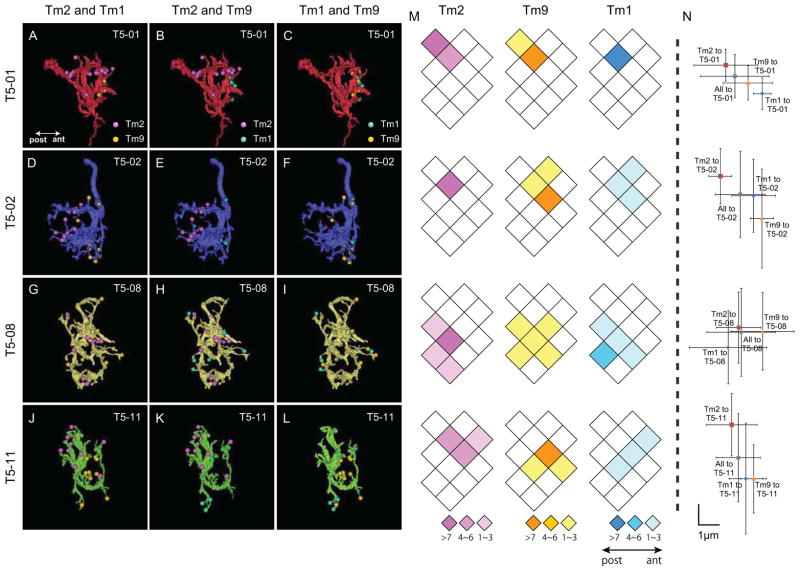
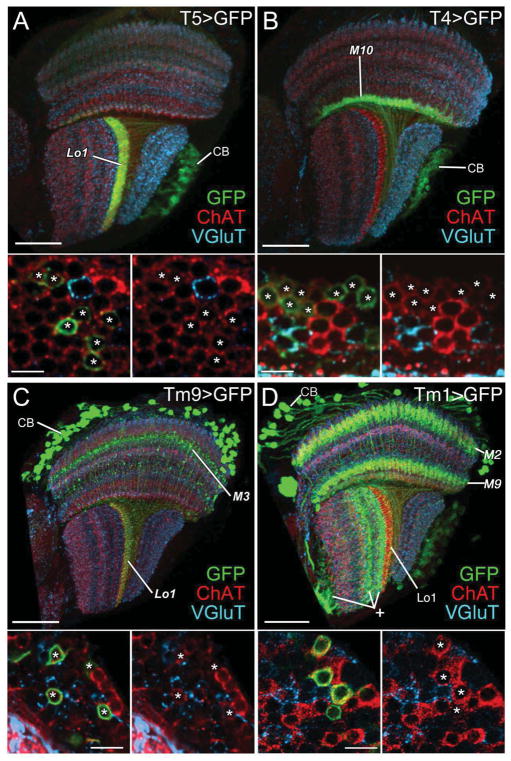
Results: Here we report that multiple types of transmedulla (Tm) neurons provide unexpectedly complex inputs to T5 at their terminals in the third neuropil, or lobula. From the L2 pathway, single-column input comes from Tm1 and Tm2 and multiple-column input from Tm4 cells. Additional input to T5 comes from Tm9, the medulla target of a third lamina interneuron, L3, providing a candidate substrate for L3's combinatorial action with L2 [3]. Most numerous, Tm2 and Tm9's input synapses are spatially segregated on T5's dendritic arbor, providing candidate anatomical substrates for the two arms of a T5 EMD circuit; Tm1 and Tm2 provide a second. Transcript profiling indicates that T5 expresses both nicotinic and muscarinic cholinoceptors, qualifying T5 to receive cholinergic inputs from Tm9 and Tm2, which both express choline acetyltransferase (ChAT).

Conclusions: We hypothesize that T5 computes small-field motion signals by integrating multiple cholinergic Tm inputs using nicotinic and muscarinic cholinoceptors.


Figures

Figure 1
Figure 1
T4 and T5 provide two independent pathways to four different lobula plate strata. (A) T4 (magenta) and T5 (green) inputs to four strata of the lobula plate, LOP (Lop1-Lop4). Tm cell inputs to T5 come via L2 (Tm1, Tm2, Tm4: cyan) and L3 (Tm9: orange) pathways from the lamina (LA). L1 pathway inputs to T4 in the proximal medulla (ME) are shown only in part for clarity, omitting the terminals of Tm3 in the lobula (LO). Orientation markers: the lobula is rotated 90° with respect to the medulla so that its anterior (ant) direction points towards the medulla and its posterior (post), towards the head’s midline (M). The lobula’s Tm cell inputs enter at its distal strata (dist), roughly towards the eye’s lateral edge (L), and extend proximally (prox). The lobula’s anterior edge receives input from frontally directed ommatidia and lamina cartridges, towards the head’s anterior (A), after two inversions of the pathways through the chiasmata between lamina and medulla, and between medulla and lobula. (B–E) Tm cell terminals innervate T5 cells in the lobula. Terminals of Tm1, Tm2, Tm4, and Tm9 at four depths in lobula stratum Lo1: 1.8μm (B); 2.8μm (C); 3.5μm (D); and 4.7μm (E) from the border with the inner chiasma. Lo1 completely contains the terminals of Tm9, Tm2 and the dendrites of T5, with Tm9 falling more superficially within this stratum [16]. The terminals of Tm2 extend deeper than those of Tm9 (ED), and Tm4 extends down to stratum Lo4. The profiles of terminals are often divided (Tm2, Tm9 in D). (F–K) Terminals of four modular Tm cell types. (F) Viewed from distal to proximal within the lobula neuropil, the terminals of 11 Tm9 cells tile the lobula, one per column, without touching; overlap is apparent, an artifact of the reconstruction angle. (G) Terminals of Tm1, Tm2 and Tm9 overlap each other as a fascicle in a single column. A bundle of horizontally directed axons in the optic chiasma (OCH) reveals the entry path for Tm axons to the neuropil. (H) Tm4’s terminal extends more deeply and is separate from the bundled terminals of the other three Tm cells, and lacks presynaptic sites in Lo2 and Lo3. (I–K) The terminal of Tm1 (I) is smallest, while the terminal of Tm9 is larger (K), more complex and compact than that of Tm2 (J), which extends deeper.
Figure 2
Figure 2
Tm cell synaptic inputs to T5 dendrites. (A) EM of lobula stratum Lo1 showing a terminal of Tm2 surrounded by T5 dendrites expressing HRP over their membranes. Insets: HRP + (red) and HRP − (green) profiles; with presynaptic T-bar ribbon visible in Tm2 (yellow) providing input to HRP labeled T5 dendrites. (B–F) Representative pairs of Tm terminals overlapping the dendritic arbor of cell T5-1. Confirming its identity the latter has a bifurcated axon with the more slender branch going to the lobula plate, and its stouter partner connecting to the cell body (arrowheads in B). With T5-1 are lateral views of: (B) Tm1 (same terminal as Figure 1I); (C) Tm2 (same terminal as Figure 1J); (D) Tm9 (same terminal as Figure 1K); and (E) Tm4 (same terminal as Figure 1H). Background: bundles of horizontally directed chiasmal axons. (F) In a tangential plane, the overlap between neighboring T5 cells: T5-02 (orange), T5-01 (yellow) and T5-11 (green) with their color-coded synaptic inputs from four types of Tm input cells, Tm1, Tm2, Tm4 and Tm9 (between 1 and 3 cells per type, color coded as in Figure 3A–L).
Figure 3
Figure 3
Anatomical receptive fields of four T5 dendritic arbors. (A–L) Four reconstructed T5 cells (T5-01 (A–C), T5-02 (D–F), T5-08 (G–I) and T5-11 (J–L) as seen from the proximal to distal face of the lobula. Synaptic input sites from three types of Tm cells (Tm1, Tm2 and Tm9) are color coded (cyan, magenta and orange, respectively) in paired combinations. Synaptic contacts (T-bar ribbons) are from Tm2 and Tm9 (A, D, G, J); Tm1 and Tm2 (B, E, H, K); or from Tm1 and Tm9 (C, F, I, L). Each Tm cell’s synaptic input is restricted to a limited zone of the T5 dendritic arbor, and input areas for different Tm cells (Tm2 and Tm1, Tm2 and Tm9) to each single T5 cell are generally segregated, suggesting that the T5 receptive field incorporates at least two pairs of anatomical subcomponent fields: Tm1/Tm2, and Tm2/Tm9. M) Diagram of the array of lobula columns, rhomboids (each assumed to correspond to a bundle of axon terminals, and to an overlying medulla column), within which are plotted the distribution of Tm cell synapses corresponding to the same T5 cells shown in the horizontal row to the left. Color-coded rhomboids indicate the number of input synapses in each column (from 1 to >7) from specific Tm cells (Tm2: magenta, Tm9: orange, Tm1: cyan). One T5 cell may receive inputs from multiple Tm cells in multiple columns, the receptive field encompassing more than a single column. For each T5 cell, inputs come from 2–6 columns overall, contributed by all three types of Tm input. These arise for each Tm input from between 1 and 5 of the columns. So, for example, comparing inputs from Tm1 with those from Tm9, most inputs arise from a corresponding set of columns, but the overlap is not perfect. Thus for T5-08, Tm9 inputs come from five columns, whereas Tm1 inputs come from only four. N) The summed numbers of synapses distributed over several columns, shown as the corresponding x, y coordinates (μm) for Tm1 (cyan), Tm2 (magenta) and Tm9 (orange) inputs, relative to their sum (grey). Error bars: SD of the x, y coordinates for each synapse, provide a measure of the spread of inputs from each Tm input. Tm2 and Tm9, and Tm1 and Tm2 provide two anatomical receptive field subcomponents with significant angular separation. The angular offset between each Tm1, Tm2 and Tm2, Tm9 pair falls in the same direction for each T5 cell, indicating congruence of the displacement vector for the T5 subtype. For T5-08 the offset between Tm2 and Tm9 is ambiguous. No significant difference is seen between the summed distributions of Tm1 and Tm9 inputs. Tm4 inputs are too few to plot reliably.
Figure 4
Figure 4
T4, T5, Tm9, and Tm1 neurons express immunoreactivity to choline acetyltransferase (ChAT, red) but not vesicular glutamate transporter (VGlut, cyan). (A–D) T5, T4, Tm9, and Tm1 neurons are labeled with the mCD8::GFP membrane marker (green) using T5-Gal4, T4-Gal4, Tm9-Gal4, and Tm1-Gal4 drivers, respectively. (A) T5-GFP expression highlights a band of dendrites in lobula stratum Lo1 and cell bodies (CB) in the lobula plate cortex and their axons in the internal chiasma between lobula and lobula plate. (B) T4-GFP expression highlights a band of dendrites concentrated in medulla stratum M10 and cell bodies (CB) in the lobula plate cortex and their axons penetrating the lobula plate and entering the internal chiasma between medulla and lobula plate. (C) Tm9-GFP expression reveals somata (CB) in the medulla cortex, axons that penetrate the medulla neuropil, an arborization in stratum M3, and a band of terminals in lobula stratum Lo1. (D) Tm1-GFP expression reveals somata (CB) in the medulla cortex, dendrites that arborize in medulla strata M2 and M9, and axons that terminate in lobula stratum Lo1. The Gal4 line also labels uncharacterized neurons in the lobula (plus sign) and lobula plate. Lower panels: high-magnification views of the corresponding cell bodies (asterisks) in the cortex of the lobula plate (A, B) and medulla (C, D), distributed amongst cell bodies of other neurons (no asterisk). The left hand image of each pair shows all three labels; for clarity the green channel is omitted in the right hand panel, to show that all GFP expressing somata are also ChAT-positive. Scale bars: 30 μm in A–D; and 5 μm in lower panels.
Figure 5
Figure 5
Models of motion detection pathways and proposed molecular mechanisms. A) Input pathways to T4 and T5 comprise single-column and multi-column (yellow) Tm cells. L1 pathways (magenta) via single-column Mi1 and multi-column Tm3 cells converge upon T4 in the proximal medulla [2]. L2 pathways (cyan) via single-column Tm1 and Tm2 [25] and multi-column Tm4 [2] cells converge upon T5 in the distal lobula, along with Tm9 [2] from the L3 pathway (yellow). T4 and T5 cells in turn provide direction-selective inputs to LPTCs. B) Hypothetical implementation of Barlow-Levick (B–L) and Hassenstein-Reichardt (H–R) models. In both, T5 is proposed to use muscarinic cholinoceptors (mAchR) to receive a delayed signal from Tm1 and Tm9, and nicotinic receptors (nAchR) to receive an instantaneous signal from Tm2. In the B–L model, these two signals converge antagonistically: the activation of nAchR increases sodium conductance and depolarizes the membrane while the activation of mAchR leads to calcium release from internal stores, the activation of a high-conductance calcium-dependent potassium (BK) channel, and eventual membrane hyperpolarization. In the H–R model, the instantaneous and delayed signals interact synergistically: activated mAchR inhibits a Kv type potassium channel, leading to membrane depolarization while activating nAchR depolarizes the membrane. PD: preferred, and NPD: non-preferred directions of motion; τ1, τ2, τa: time delays in Tm1, Tm9, and T5, respectively.

Comment in

Similar articles

Cited by

References

    1. Maisak MS, Haag J, Ammer G, Serbe E, Meier M, Leonhardt A, Schilling T, Bahl A, Rubin GM, Nern A, et al. A directional tuning map of Drosophila elementary motion detectors. Nature. 2013;500:212–216. - PubMed
    1. Takemura S, Bharioke A, Lu Z, Nern A, Vitaladevuni S, Rivlin PK, Katz WT, Olbris DJ, Plaza SM, Winston P, et al. A visual motion detection circuit suggested by Drosophila connectomics. Nature. 2013;500:175–181. - PMC - PubMed
    1. Silies M, Gohl DM, Fisher YE, Freifeld L, Clark DA, Clandinin TR. Modular use of peripheral input channels tunes motion-detecting circuitry. Neuron. 2013;79:111–127. - PMC - PubMed
    1. Hassenstein B, Reichardt W. Systemtheoretische Analyse der Zeit-, Reihenfolgen- und Vorzeichenauswertung bei der Bewegungsperzeption des Rüsselkäfers Chlorophanus. Z Naturforsch. 1956;11:513–524.
    1. Reichardt W. Autocorrelation, a principle for the evaluation of sensory information by the central nervous system. In: Rosenblith WA, editor. In Sensory communication. New York/London: MIT Press; 1961. pp. 303–317.

Publication types

LinkOut - more resources