. 2014 May 1;94(5):710-20.
doi: 10.1016/j.ajhg.2014.03.019. Epub 2014 Apr 24.

Simulation of Finnish population history, guided by empirical genetic data, to assess power of rare-variant tests in Finland

Collaborators, Affiliations

Simulation of Finnish population history, guided by empirical genetic data, to assess power of rare-variant tests in Finland

Sophie R Wang et al. Am J Hum Genet. .

Abstract

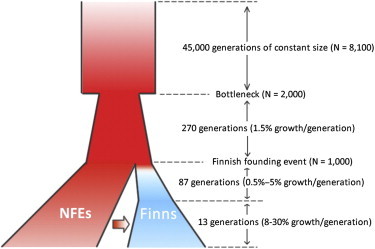
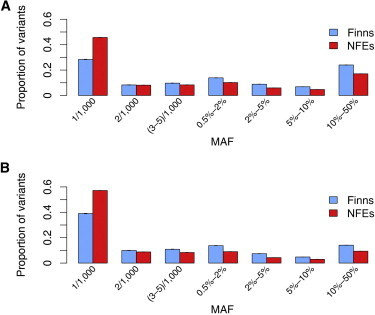
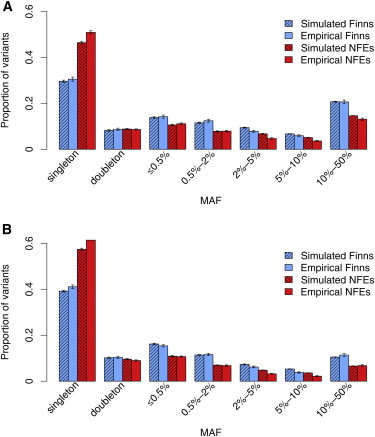
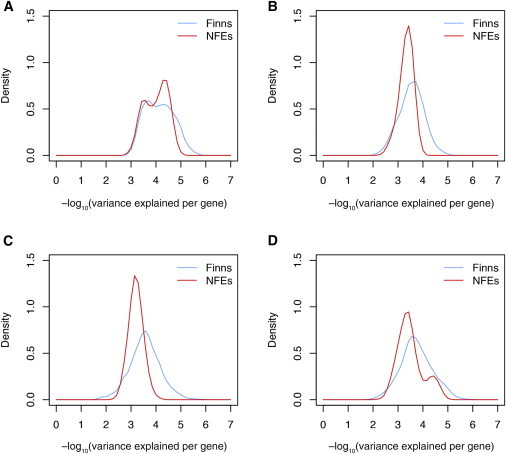
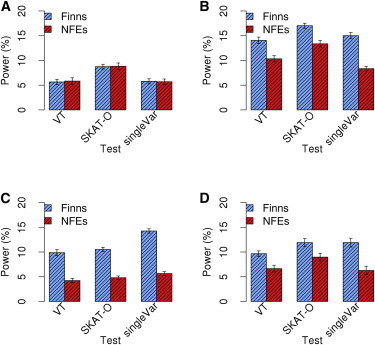
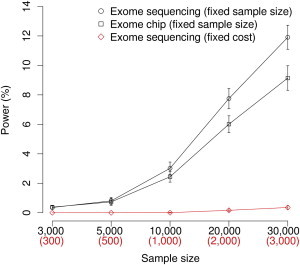
Finnish samples have been extensively utilized in studying single-gene disorders, where the founder effect has clearly aided in discovery, and more recently in genome-wide association studies of complex traits, where the founder effect has had less obvious impacts. As the field starts to explore rare variants' contribution to polygenic traits, it is of great importance to characterize and confirm the Finnish founder effect in sequencing data and to assess its implications for rare-variant association studies. Here, we employ forward simulation, guided by empirical deep resequencing data, to model the genetic architecture of quantitative polygenic traits in both the general European and the Finnish populations simultaneously. We demonstrate that power of rare-variant association tests is higher in the Finnish population, especially when variants' phenotypic effects are tightly coupled with fitness effects and therefore reflect a greater contribution of rarer variants. SKAT-O, variable-threshold tests, and single-variant tests are more powerful than other rare-variant methods in the Finnish population across a range of genetic models. We also compare the relative power and efficiency of exome array genotyping to those of high-coverage exome sequencing. At a fixed cost, less expensive genotyping strategies have far greater power than sequencing; in a fixed number of samples, however, genotyping arrays miss a substantial portion of genetic signals detected in sequencing, even in the Finnish founder population. As genetic studies probe sequence variation at greater depth in more diverse populations, our simulation approach provides a framework for evaluating various study designs for gene discovery.


Figures

Figure 1
Figure 1
The Final Demographic Model for Simulating NFEs and Finns Simultaneously The NFEs were modeled as long-term (45,000 generations) constant size (N = 8,100) followed by a bottleneck (N = 2,000) and then by exponential growth (1.5% growth per generation). To model the Finns, we tested three general classes of models, of which only one (class 3 in Table S2) approximated the empirical observations. In this model, after the initial founding event (100 generations ago, N = 1,000), the Finns went through a slow growth phase (0.5%–5% growth per generation) and then a more recent fast growth phase (8%–30% growth per generation); there was gene flow from the NFEs to the Finns.
Figure 2
Figure 2
Empirically Observed Allele Frequency Spectra in 500 Finns and 500 NFEs Means and SDs of proportions were calculated on the basis of 100 rounds of sampling. There was an excess of common variants in the Finns for both synonymous (A) and missense (B) variants.
Figure 3
Figure 3
Agreement of Empirical Allele Frequency Spectra with the Modeled Spectra Sample sizes were 843 for the Finns and 820 for the NFEs. Synonymous variants (A) and missense variants (B) are shown. Means and SDs of proportions were calculated on the basis of 100 rounds of sampling, and 1,000 genes were sampled for each round.
Figure 4
Figure 4
Distribution of Variance Explained per Gene Distribution of variance explained per gene by variants with a MAF < 5% under four different disease models in either 30,000 Finns or 30,000 NFEs. (A) M1 (τ = 0). (B) M2 (τ = 0.5). (C) M3 (τ = 1). (D) M4 (τ randomly sampled from 0, 0.5, and 1 for each effect gene).
Figure 5
Figure 5
Power of Exome Sequencing Studies in 30,000 Finns versus 30,000 NFEs We simulated a QT (h2 = 80%) for which aggregated coding variation in 1,000 genes explains the total heritability. We generated models M1–M4 by varying the degree of coupling (τ) between a causal variant’s phenotypic effect and the strength of purifying selection against that variant. We compared SKAT-O, the VT test, and single-variant tests (singleVar). For each model, means and SDs of power were calculated on the basis of 20 simulated data sets. (A) M1 (τ = 0). (B) M2 (τ = 0.5). (C) M3 (τ = 1). (D) M4 (τ randomly sampled from 0, 0.5, and 1 for each effect gene).
Figure 6
Figure 6
Power of Exome Chip Study versus Exome Sequencing Study in the Finns The comparison was done under M4 with SKAT-O. Because different genes are likely to have different pleiotropic effects and are therefore exposed to different strengths of purifying selection, M4 was generated to represent a potentially more realistic scenario. The top two lines show power comparison at a fixed sample size; the bottom two lines show power comparison at a fixed cost (and thus only one-tenth of the samples were sequenced). For both exome chip and exome sequencing studies, means and SDs of power were calculated on the basis of 20 simulated data sets.

References

    1. Peltonen L., Jalanko A., Varilo T. Molecular genetics of the Finnish disease heritage. Hum. Mol. Genet. 1999;8:1913–1923. - PubMed
    1. Nevanlinna H.R. The Finnish population structure. A genetic and genealogical study. Hereditas. 1972;71:195–236. - PubMed
    1. de la Chapelle A. Disease gene mapping in isolated human populations: the example of Finland. J. Med. Genet. 1993;30:857–865. - PMC - PubMed
    1. Lahermo P., Sajantila A., Sistonen P., Lukka M., Aula P., Peltonen L., Savontaus M.L. The genetic relationship between the Finns and the Finnish Saami (Lapps): analysis of nuclear DNA and mtDNA. Am. J. Hum. Genet. 1996;58:1309–1322. - PMC - PubMed
    1. de la Chapelle A., Wright F.A. Linkage disequilibrium mapping in isolated populations: the example of Finland revisited. Proc. Natl. Acad. Sci. USA. 1998;95:12416–12423. - PMC - PubMed

Publication types

LinkOut - more resources