. 2014 May 8;157(4):964-78.
doi: 10.1016/j.cell.2014.03.036. Epub 2014 Apr 24.

Reconstruction of the mouse otocyst and early neuroblast lineage at single-cell resolution

Affiliations

Reconstruction of the mouse otocyst and early neuroblast lineage at single-cell resolution

Robert Durruthy-Durruthy et al. Cell. .

Abstract

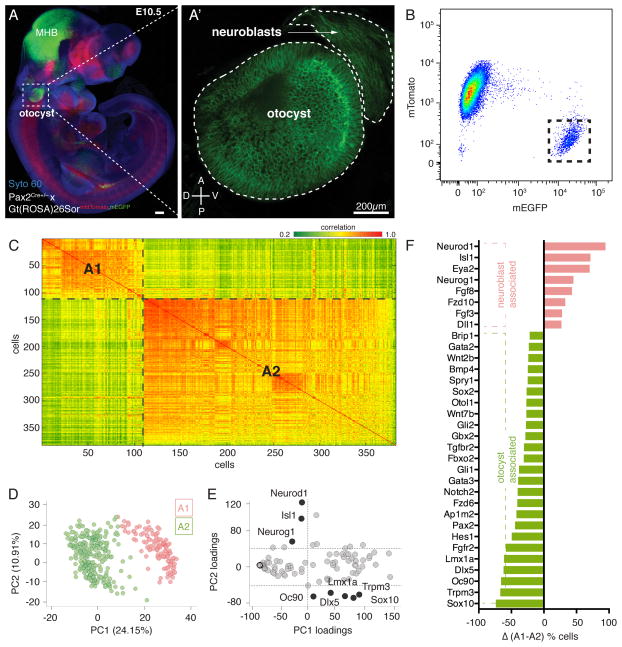
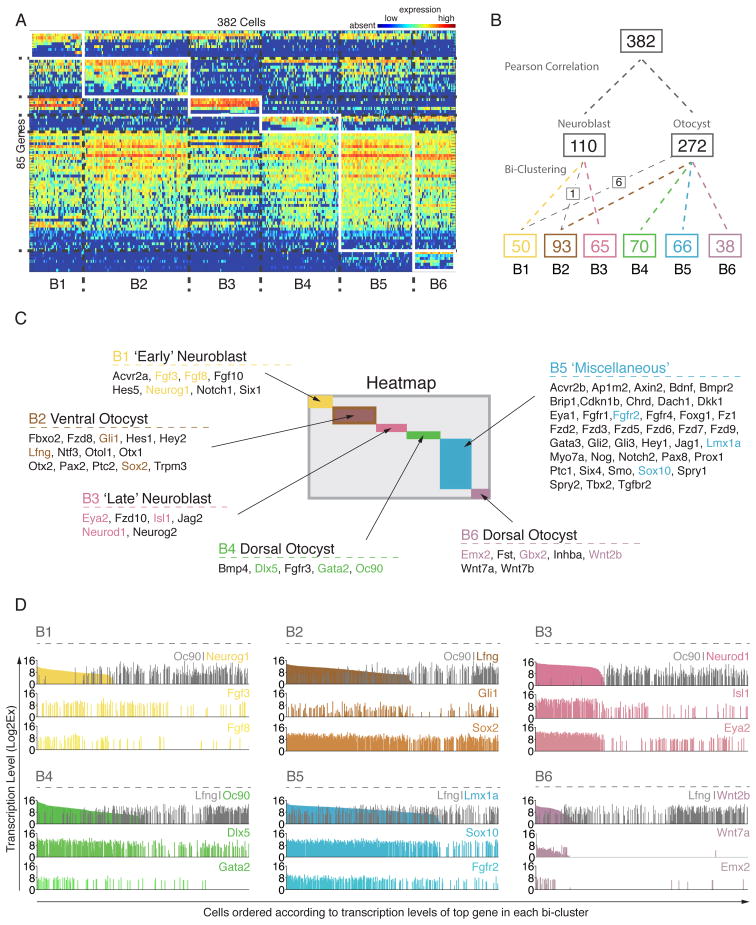
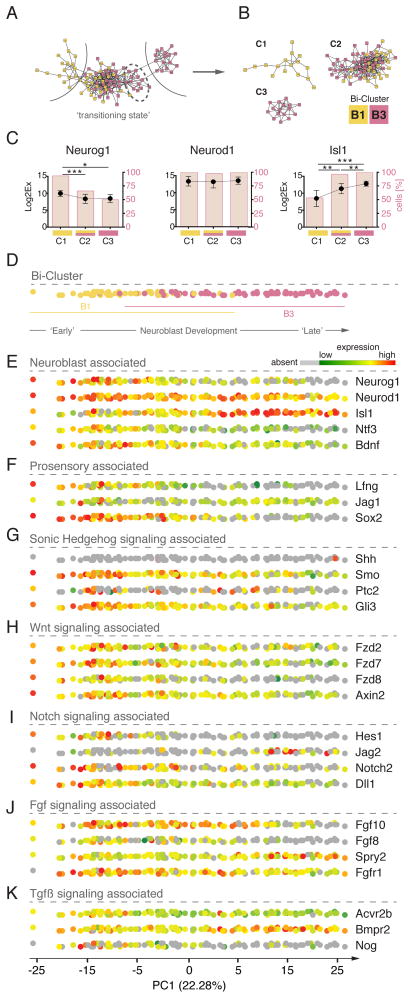
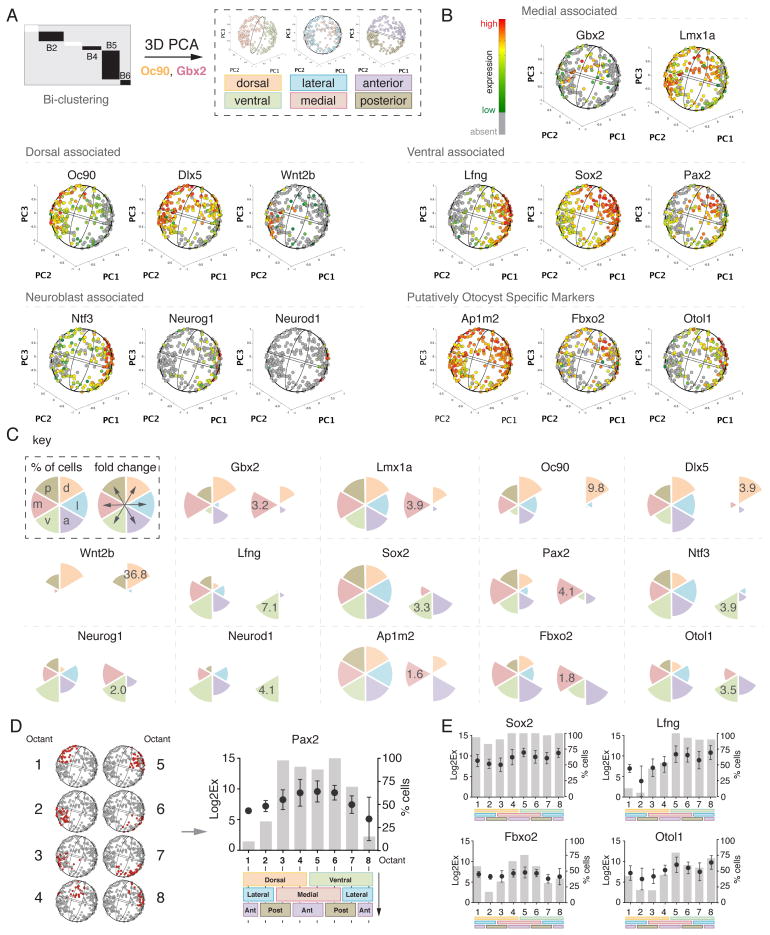
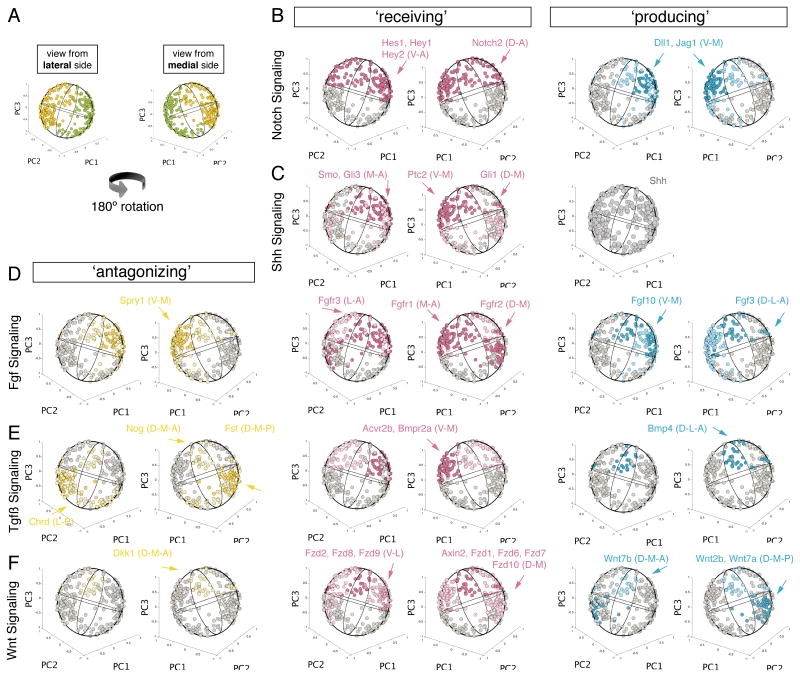
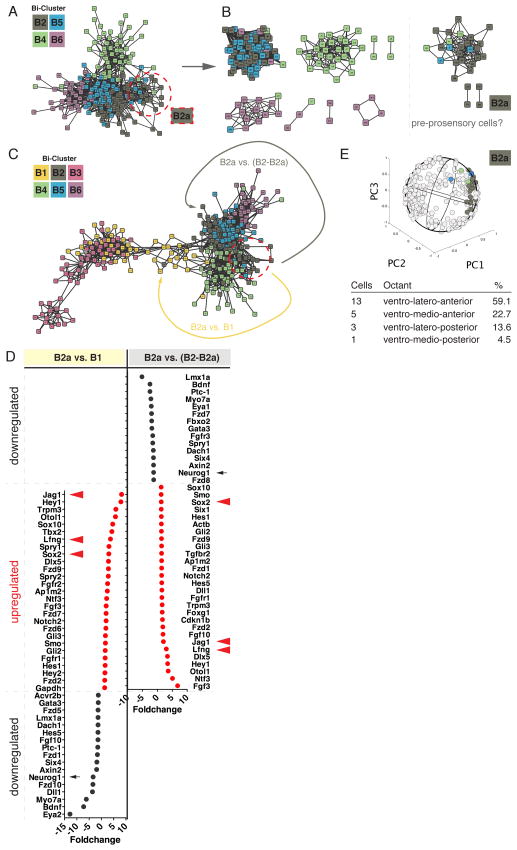
The otocyst harbors progenitors for most cell types of the mature inner ear. Developmental lineage analyses and gene expression studies suggest that distinct progenitor populations are compartmentalized to discrete axial domains in the early otocyst. Here, we conducted highly parallel quantitative RT-PCR measurements on 382 individual cells from the developing otocyst and neuroblast lineages to assay 96 genes representing established otic markers, signaling-pathway-associated transcripts, and novel otic-specific genes. By applying multivariate cluster, principal component, and network analyses to the data matrix, we were able to readily distinguish the delaminating neuroblasts and to describe progressive states of gene expression in this population at single-cell resolution. It further established a three-dimensional model of the otocyst in which each individual cell can be precisely mapped into spatial expression domains. Our bioinformatic modeling revealed spatial dynamics of different signaling pathways active during early neuroblast development and prosensory domain specification.


Figures

Figure 1
Figure 1. Sorted Single Cells can be Grouped into Corresponding Cell Identities using Multivariate Analyses
(A) Representative image of E10.5-old Pax2Cre+/−;Gt(ROSA)26SormtdTomato,mEGFP embryo. Green fluorescence (mEGFP) indicates Cre-mediated recombination labeling the otic lineage from placode to otocyst. The midbrain-hindbrain boundary (MHB) area is also notably labeled. (A′) Otocyst and delaminated neuroblast cells on the ventro-anterior region are mEGFP positive. (B) FACS plot shows two main cell populations: mTomato+/mEGFP− and mTomato−/mEGFP+, which were gated for single cell sorting. (C) Pearson Correlation of 382 single cells from otocysts and neuroblasts; 2 cells of the originally collected population of 384 were excluded from the analysis. Red indicates high positive correlation. Green represents high negative correlation. (D) PCA of 382 cells projected onto the first two components. (E) Genes projected onto first two principal component loadings. Thresholds of 0 (PC1), and −40 (PC2) were applied to determine transcripts along first PC loading. Thresholds values of +40 (PC1) and 0 (PC2) were used to determine transcripts along second PC loading. (F) Binary analysis of different genes whose expression was on or off in each group (A1/A2). Shown are the proportion differences of cells between cluster A1 and A2 in descending order from top to bottom. Red indicates genes that are overrepresented in cells of the A1 cluster. Green represents genes that are expressed in relatively more cells in cluster A2. See also Figures S1–S4 and Tables S1 and S2E.
Figure 2
Figure 2. Organizing the Cellular Heterogeneity of Otocyst Cells and Neuroblasts into Bi-Clusters with Distinct Transcriptional Profiles
(A) Heatmap of all 382 cells and 85 genes after bi-cluster analysis. Two reference and 9 other genes were excluded from the analysis because they were expressed by fewer than 5 cells. Six distinguishable cell groups are clustered according to transcriptional gene signatures. (B) Cluster tree showing the overlapping partitions of cells generated by two independent and unbiased grouping algorithms. Pearson Correlation distinguishes two main groups. Bi-clustering resulted in six clusters, which almost perfectly represent sub-clusters of the two main groups generated by Pearson Correlation, except for 1 neuroblast and 6 otocyst cells that were reassigned as indicated. Numbers indicate cell number per group. (C) Genes that delineate each bi-cluster are listed. Expression of colored markers is shown in (D) at single cell resolution. (D) Six representative examples for 4 genes each show expression distribution (y-axis) across all 382 cells (X-axis). Cells from each cluster are ordered according to expression levels of the first gene (high to low expression) so that each cell is located at the same location on the X-axis. In grey are shown two hallmark genes of dorsal (Oc90) and ventral (Lfng) character for comparison. See also Figures S5 and S6, and Table S2E.
Figure 3
Figure 3. Otic Neurogenesis can be Resolved Based on Gene Expression Changes at Single Cell Resolution
(A) Co-expression gene network representation. Colors represent bi-cluster association. (B) Network topology analysis revealed three sub-networks. (C) Quantitation of expression level and fraction of cells per sub-network of three hallmark genes of neuroblast development. Black dots indicate transcriptional levels. Red bars represent cell proportions. Shown are means and standard deviations. P values are adjusted for multiple comparisons: * indicates p < 0.05, ** p < 0.01, *** p < 0.001. (D) PCA of 115 neuroblast cells. Cells are projected onto the first principal component and color-coded based on bi-cluster affiliation (B1 and B3). (E) Visualization of cellular transcriptional levels of neuroblast associated genes from high (red) to low (green) or absent (grey). (F) Expression of selected pro-sensory markers is visualized onto 1D PC projection. (G) – (K) Visualization of transcriptional levels of signaling pathway linked genes: Shh, Wnt, Notch, Fgf, Tgfβ. See also Figure S7 and Table S2E.
Figure 4
Figure 4. Three-Dimensional Reconstruction of the Mouse Otocyst Using PCA
(A) Schematic overview of the bioinformatics algorithm to compute a three-dimensional model of the otocyst. (B) Transcriptional levels of selected marker genes projected onto 3D model representation. (C) Quantitation of % proportion of cells (left radial pie graph) and fold change between opposing body axes (right radial pie graph) for selected genes as shown in (B). (D) Representative illustration of octant analysis. Corresponding octant number is visualized in red in the 3D otocyst model. Quantitation of expression level and relative number of cells is octant-based. Color-code: d=dorsal (orange), v=ventral (green), l=lateral (blue), m=medial (red), p=posterior (brown), a=anterior (purple). (E) Octant analysis for two candidate genes from the pro-sensory (Sox2 and Lfng) and novel marker category, respectively. See also Table S2, and movies S1–S4.
Figure 5
Figure 5. Regulatory Pathways Mapped onto Otocyst Reconstruction Model Confirms Distinct Regions of Signaling and Identifies New Spatially Defined Areas of Signaling
(A) Schematic overview of 3D sphere rotational arrangement. The left sphere shows the view from the lateral (front) side in which the ventral domain (green) is positioned on the right side. (dorsal side shown in yellow on left side). The right sphere shows the view from the medial (back) side after a 180 degree rotation along PC3 axis. (B) Areas of Notch signaling are color-coded in an octant specific way. Red indicates areas of ‘receiving’ domains based on expression data of receptor or effector genes. Blue = domains of ‘producing’ fields based on expression data of ligand genes. Yellow = fields of ‘antagonizing’ domains based on expression data of signaling inhibiting genes. (C) – (F) Areas color-coded onto 3D model of active Shh, Fgf, Tgfβ, and Wnt signaling.
Figure 6
Figure 6. Characterization of an Otocyst Cell Population with Pre-Prosensory Cellular Identity
(A) Co-expression network representation of 272 otocyst associated cells. Color code corresponds to bi-clusters shown in Figure 2. (B) Network topology analysis reveals a subnetwork primarily consisting of B2 associated cells (B2a). (C) Network architecture of all 382 otocyst/neuroblast cells. (D) Expression fold changes for two comparisons: B2a (‘pre-prosensory’) versus B1 (‘early neuroblast’), and B2a versus the remaining B2 cells (B2–B2a) (‘ventral otocyst’). Data in red indicates upregulation of genes in both juxtapositions. Pro-sensory markers are indicated by red arrowheads. Early neuroblast marker Neurog1 is indicated by a black arrow. (E) Visualization of B2a labeled cells onto 3D otocyst model reveals a ventral-anterior association at the medial/lateral boundary.

Comment in

References

    1. Abello G, Khatri S, Giraldez F, Alsina B. Early regionalization of the otic placode and its regulation by the Notch signaling pathway. Mech Dev. 2007;124:631–645. - PubMed
    1. Alsina B, Abello G, Ulloa E, Henrique D, Pujades C, Giraldez F. FGF signaling is required for determination of otic neuroblasts in the chick embryo. Dev Biol. 2004;267:119–134. - PubMed
    1. Alsina B, Giraldez F, Pujades C. Patterning and cell fate in ear development. Int J Dev Biol. 2009;53:1503–1513. - PubMed
    1. Basch ML, Ohyama T, Segil N, Groves AK. Canonical Notch signaling is not necessary for prosensory induction in the mouse cochlea: insights from a conditional mutant of RBPjkappa. J Neurosci. 2011;31:8046–8058. - PMC - PubMed
    1. Bok J, Dolson DK, Hill P, Ruther U, Epstein DJ, Wu DK. Opposing gradients of Gli repressor and activators mediate Shh signaling along the dorsoventral axis of the inner ear. Development. 2007;134:1713–1722. - PubMed

Publication types