. 2014 Aug:68:156-66.
doi: 10.1016/j.nbd.2014.04.004. Epub 2014 Apr 21.

Relationship between oscillatory activity in the cortico-basal ganglia network and parkinsonism in MPTP-treated monkeys

Affiliations

Relationship between oscillatory activity in the cortico-basal ganglia network and parkinsonism in MPTP-treated monkeys

Annaelle Devergnas et al. Neurobiol Dis. 2014 Aug.

Abstract

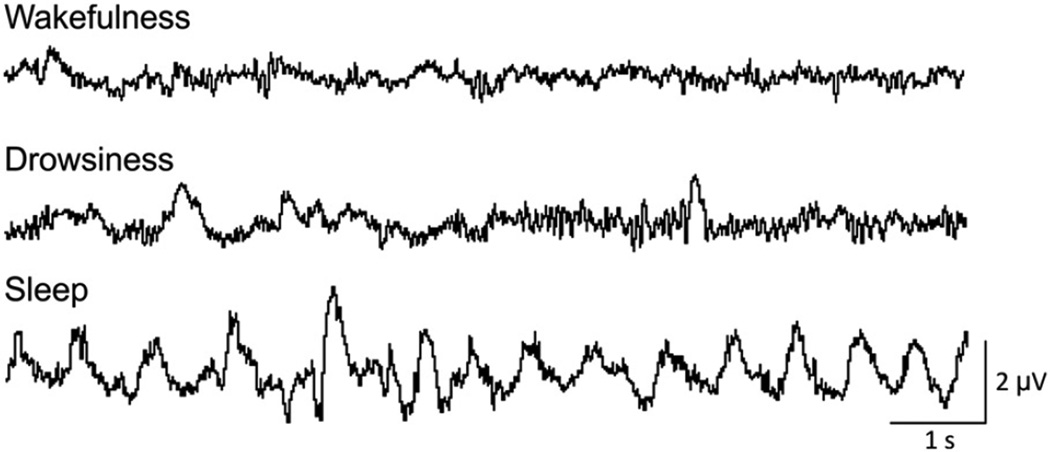
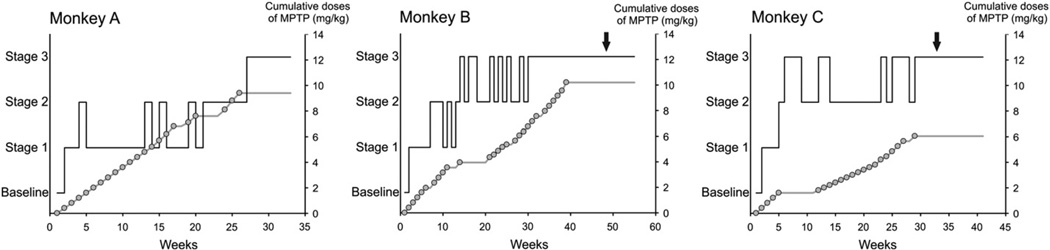
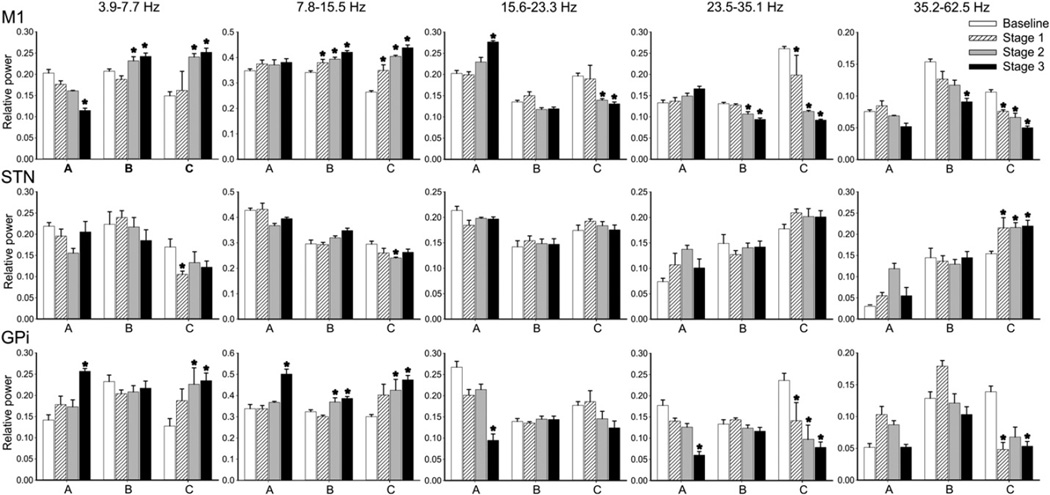
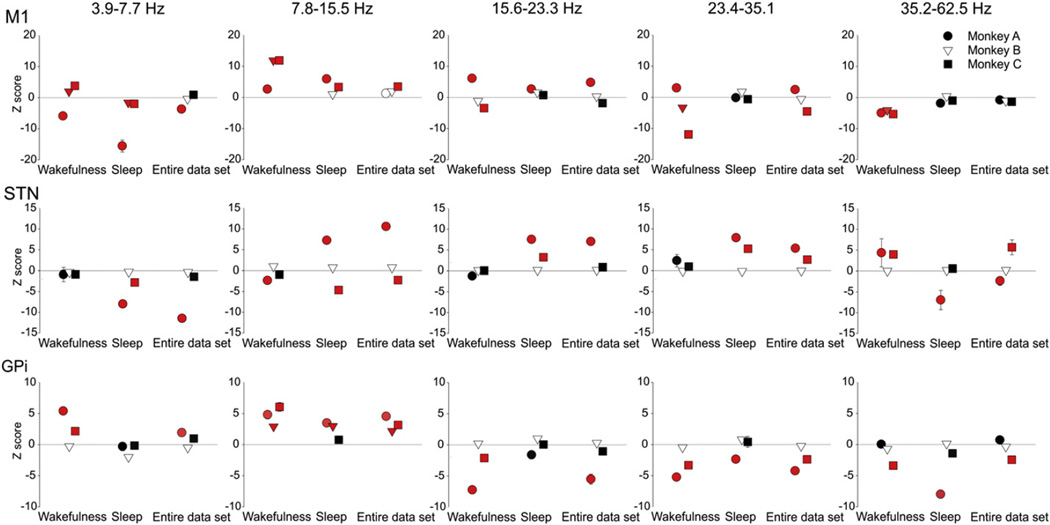
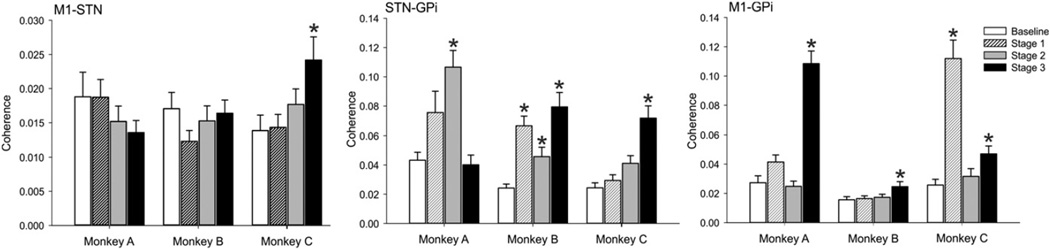
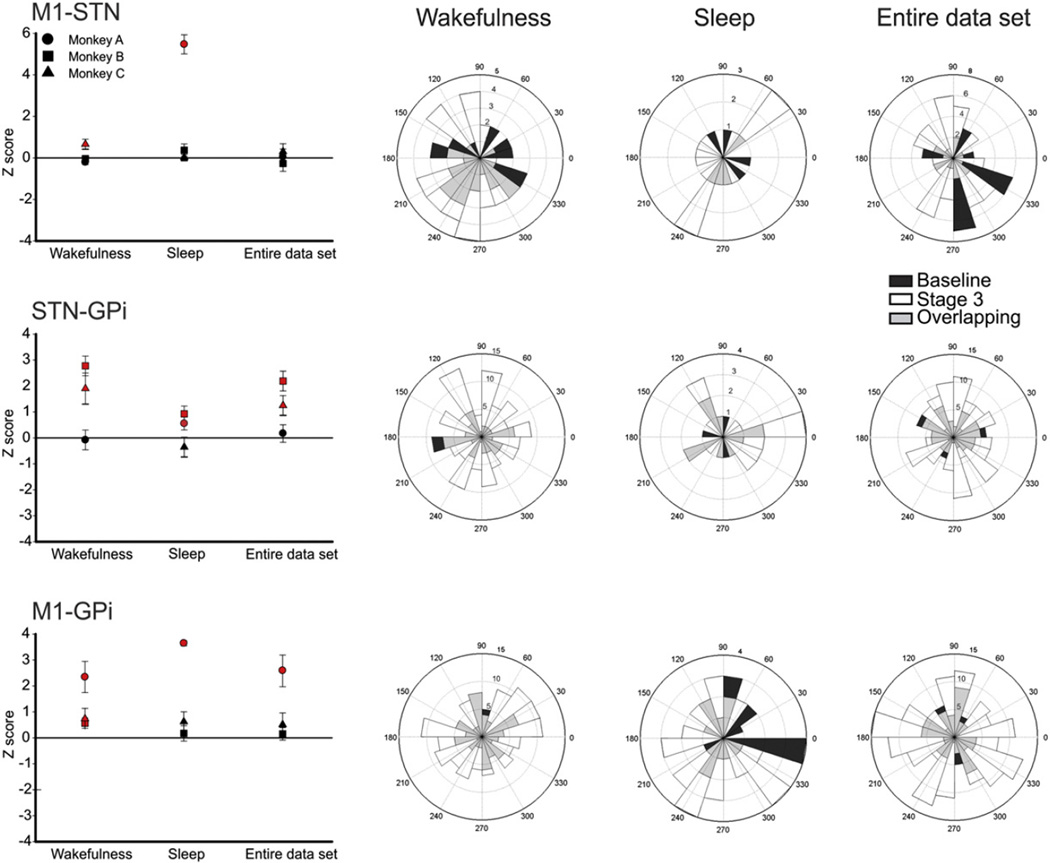
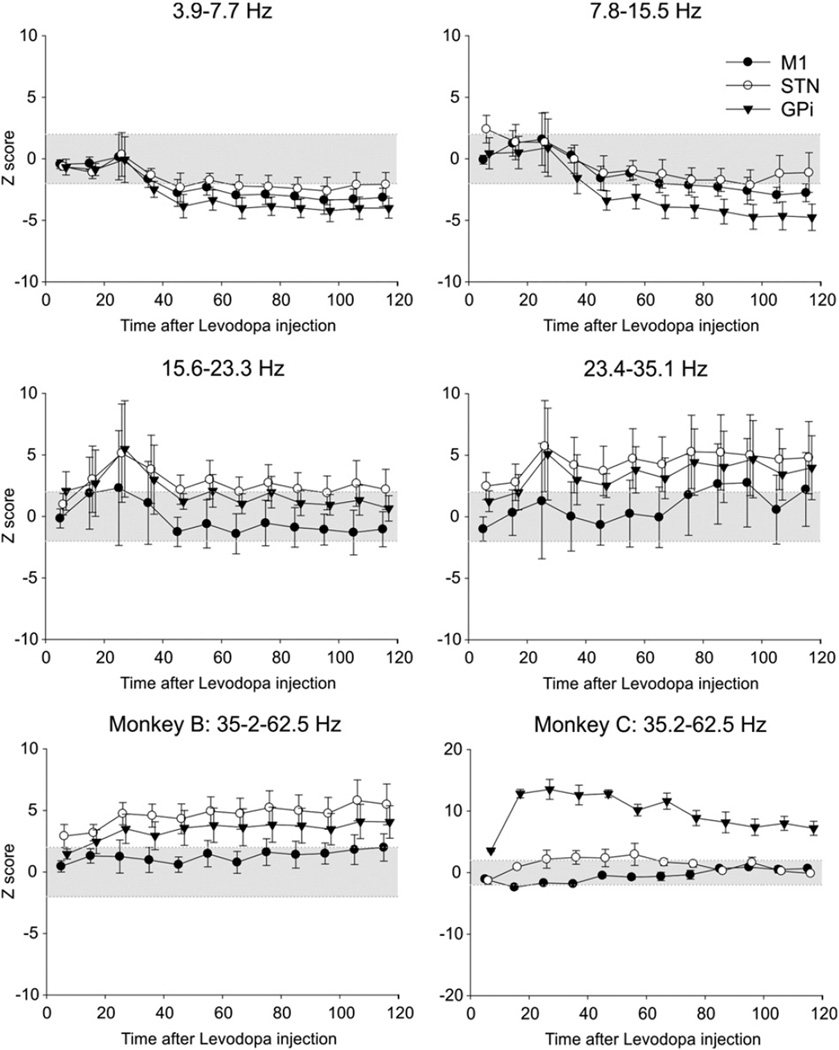
Parkinsonism is associated with changes in oscillatory activity patterns and increased synchronization of neurons in the basal ganglia and cortex in patients and animal models of Parkinson's disease, but the relationship between these changes and the severity of parkinsonian signs remains unclear. We examined this relationship by studying changes in local field potentials (LFPs) in the internal pallidal segment (GPi) and the subthalamic nucleus (STN), and in encephalographic signals (EEG) from the primary motor cortex (M1) in Rhesus monkeys which were rendered progressively parkinsonian by repeated systemic injections of small doses of the neurotoxin 1-methyl-4-phenyl-1,2,3,6-tetrahydropyridine (MPTP). Observations during wakefulness and sleep (defined by EEG and video records) were analyzed separately. The severity of parkinsonism correlated with increases in spectral power at frequencies below 15.5Hz in M1 and GPi and reductions in spectral power at frequencies above 15.6Hz with little change in STN. The severity of parkinsonism also correlated with increases in the coherence between M1 EEG and basal ganglia LFPs in the low frequency band. Levodopa treatment reduced low-frequency activity and increased high-frequency activity in all three areas, but did not affect coherence. The state of arousal also affected LFP and EEG signals in all three structures, particularly in the STN. These results suggest that parkinsonism-associated changes in alpha and low-beta band oscillatory activity can be detected early in the parkinsonian state in M1 and GPi. Interestingly, oscillations detectable in STN LFP signals (including oscillations in the beta-band) do not appear to correlate strongly with the severity of mild-to-moderate parkinsonism in these animals. Levodopa-induced changes in oscillatory M1 EEG and basal ganglia LFP patterns do not necessarily represent a normalization of abnormalities caused by dopamine depletion.

Keywords: Basal ganglia; Local field potential; Motor cortex; Parkinson's disease; Sleep; Wakefulness.


Figures

Fig. 1
Fig. 1
Examples of M1 EEG recordings in monkey B, of 10 second epochs scored as representing wakefulness, drowsiness, or sleep. Calibration bars apply to all traces.
Fig. 2
Fig. 2
Temporal progression of the development of parkinsonism induced by MPTP injections, based on weekly evaluations. The solid black line shows the stage of parkinsonism. The cumulative dose of MPTP is shown as a gray line with open circles, where each circle corresponds to a single MPTP injection (0.2–0.6 mg/kg). The arrow indicates the start of levodopa testing (only done in monkeys B and C).
Fig. 3
Fig. 3
(2-column image) Relative spectral power (mean ± SEM) ofM1, STN and GPi signals (EEG, LFPs) across different stages of parkinsonism in monkeys A, B, and C. * indicates p < 0.05, compared to baseline; 2-way ANOVA with post-hoc Holm–Sidak testing.
Fig. 4
Fig. 4
Z-scored changes between baseline and stage 3 parkinsonism in spectral power of M1 EEGs, and STN or GPi LFPs, analyzed separately for wakefulness, sleep, or the entire data set (encompassing wakefulness, drowsiness and sleep). Red symbols correspond to significant comparisons. p < 0.05, compared to normal state, 2-way ANOVA with post-hoc Holm–Sidak testing.
Fig. 5
Fig. 5
Coherence between M1 and STN, STN and GPi, and M1 and GPi signals in the 7.8–15.5 Hz frequency range across different stages of parkinsonism during periods of wakefulness, in monkeys A, B and C. * indicates p < 0.05 compared to baseline; two-way ANOVA with post-hoc Holm–Sidak testing.
Fig. 6
Fig. 6
Comparison of M1–STN, STN–GPi, and M1–GPi coherence and phase angles in the 7.8–15.5 Hz range between baseline and stage 3 of parkinsonism across different states of arousal. The plots on the left show Z-scored coherence values for the 3 monkeys. Significant values (p < 0.05, comparisons between controls and stage 3 recordings) are indicated in red. The plots on the right are polar representation of preferred phase angles for the three signal pairs, at baseline and in stage 3 of parkinsonism across different states of arousal. For the phase representation, the data from all three animals were combined. The phase angles are shown in degrees. The numbers on the polar lines correspond to the number of the recording session in which the respective phase angle was found; phase angles measured in pre-MPTP baseline recordings are shown in white, those measured in stage 3 parkinsonism are shown in black. The gray markers correspond to the sessions in which baseline and stage 3 parkinsonism shared the same preferred phase angle (‘Overlapping’). Coherence and phase comparisons were done separately for each monkey using a Mann–Whitney rank sum test (p < 0.05), using recordings from the baseline period and from stage 3 of parkinsonism.
Fig. 7
Fig. 7
Motor activity, as measured by counting infrared beam breaks in an activity monitoring cage, after levodopa injection (monkeys B and C) or saline injection (monkey C). Injections were given at time 0. Each data point represents the mean ± SEM of 3 experiments.
Fig. 8
Fig. 8
Summary of levodopa-induced changes in spectral power inM1 EEG, and STN– and GPi–LFPs. Injections were given at time 0 and changes (calculated for 10 min increments) are expressed as Z-score values, compared to the respective baselines. The figure shows data from monkey B in all but the last subplot. Changes were similar between monkeys, except for the 35.2–62.5 Hz range which is shown separately for monkeys B and C. Shown are results of an analysis of M1 EEG signals (filled circles, mean ± SEM), as well as LFPs from the STN (open circles) and GPi (triangles). The area marked in gray corresponds to Z-score values of ±2.

References

    1. Adler A, Joshua M, Rivlin-Etzion M, Mitelman R, Marmor O, Prut Y, Bergman H. Neurons in both pallidal segments change their firing properties similarly prior to closure of the eyes. J. Neurophysiol. 2010;103:346–359. - PubMed
    1. Avila I, Parr-Brownlie LC, Brazhnik E, Castaneda E, Bergstrom DA, Walters JR. Beta frequency synchronization in basal ganglia output during rest and walk in a hemiparkinsonian rat. Exp. Neurol. 2009;221:307–319. - PMC - PubMed
    1. Barraud Q, Lambrecq V, Forni C, McGuire S, Hill M, Bioulac B, Balzamo E, Bezard E, Tison F, Ghorayeb I. Sleep disorders in Parkinson's disease: the contribution of the MPTP non-human primate model. Exp. Neurol. 2009;219:574–582. - PubMed
    1. Baudrexel S, Witte T, Seifried C, von Wegner F, Beissner F, Klein JC, Steinmetz H, Deichmann R, Roeper J, Hilker R. Resting state fMRI reveals increased subthalamic nucleus-motor cortex connectivity in Parkinson's disease. Neuroimage. 2011;55:1728–1738. - PubMed
    1. Bergman H, Wichmann T, Karmon B, DeLong MR. The primate subthalamic nucleus. II. Neuronal activity in the MPTP model of parkinsonism. J. Neurophysiol. 1994;72:507–520. - PubMed

Publication types

MeSH terms