. 2014 Jul 15:487:82-90.
doi: 10.1016/j.scitotenv.2014.03.138. Epub 2014 Apr 27.

Effect of wind speed and relative humidity on atmospheric dust concentrations in semi-arid climates

Affiliations

Effect of wind speed and relative humidity on atmospheric dust concentrations in semi-arid climates

Janae Csavina et al. Sci Total Environ. .

Abstract

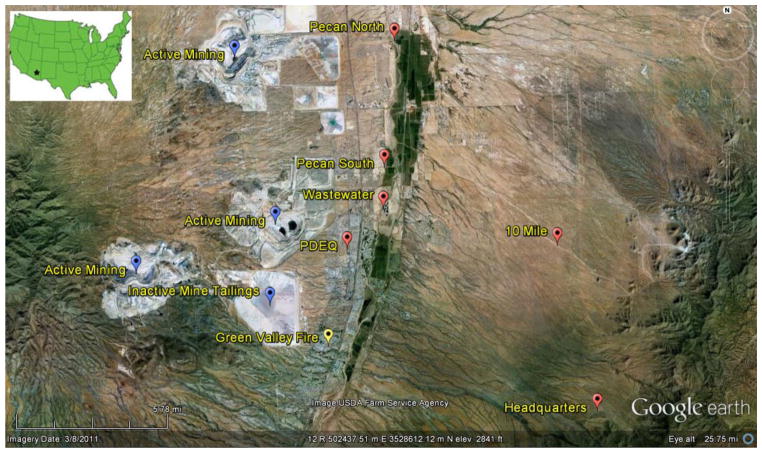
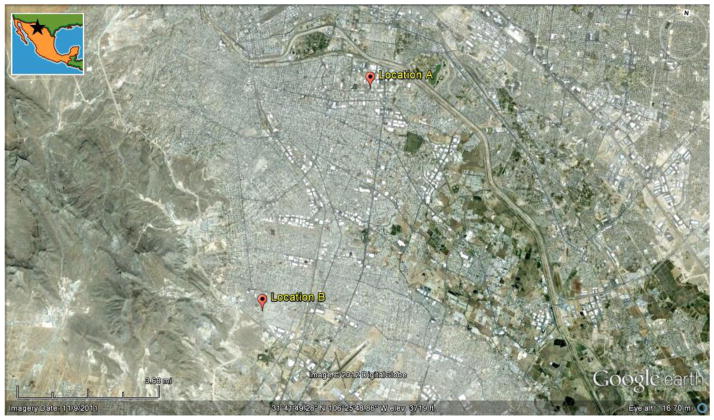
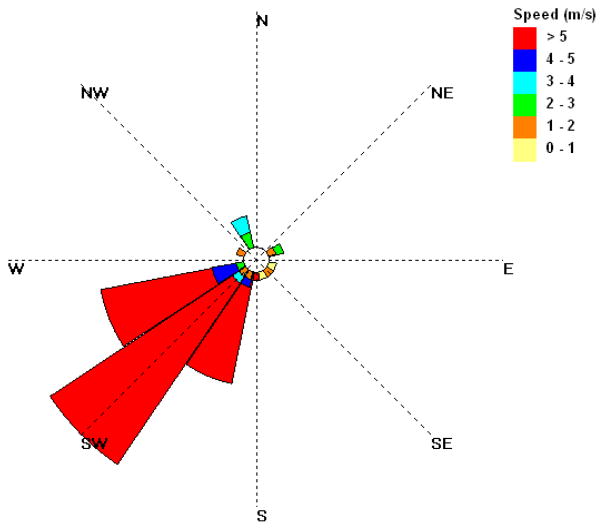
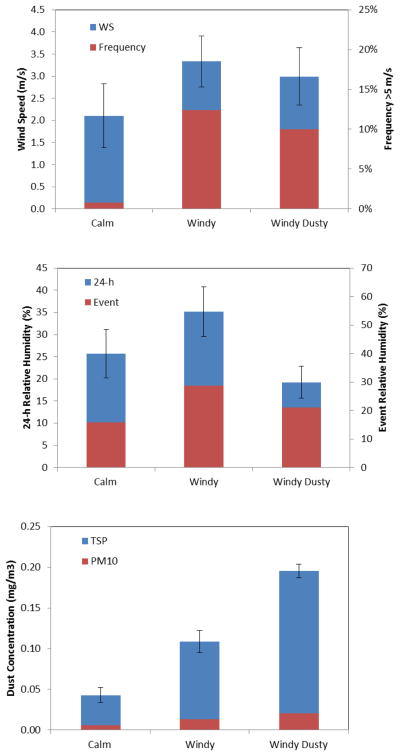
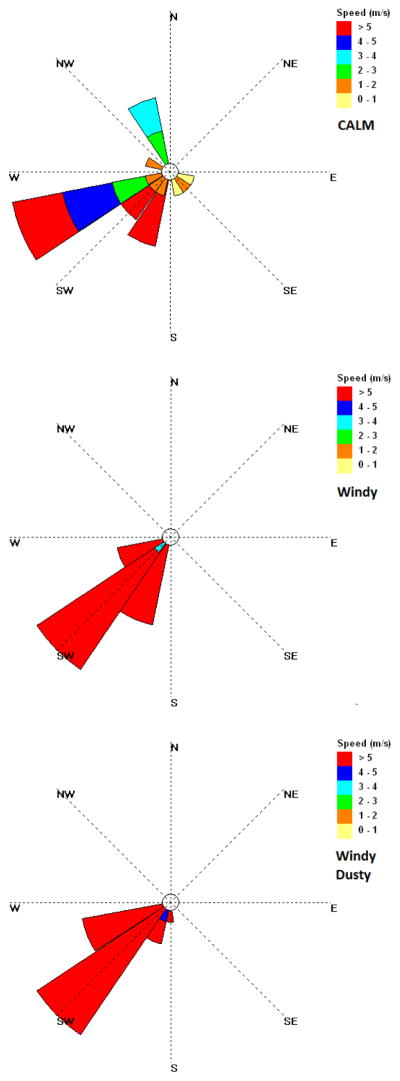
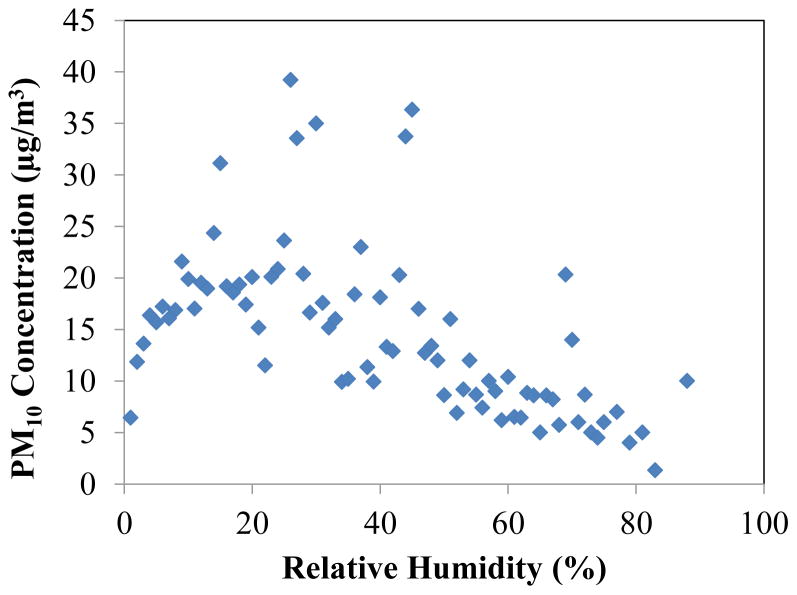
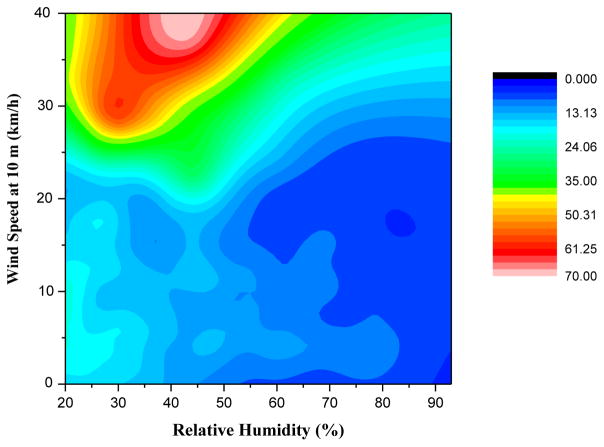
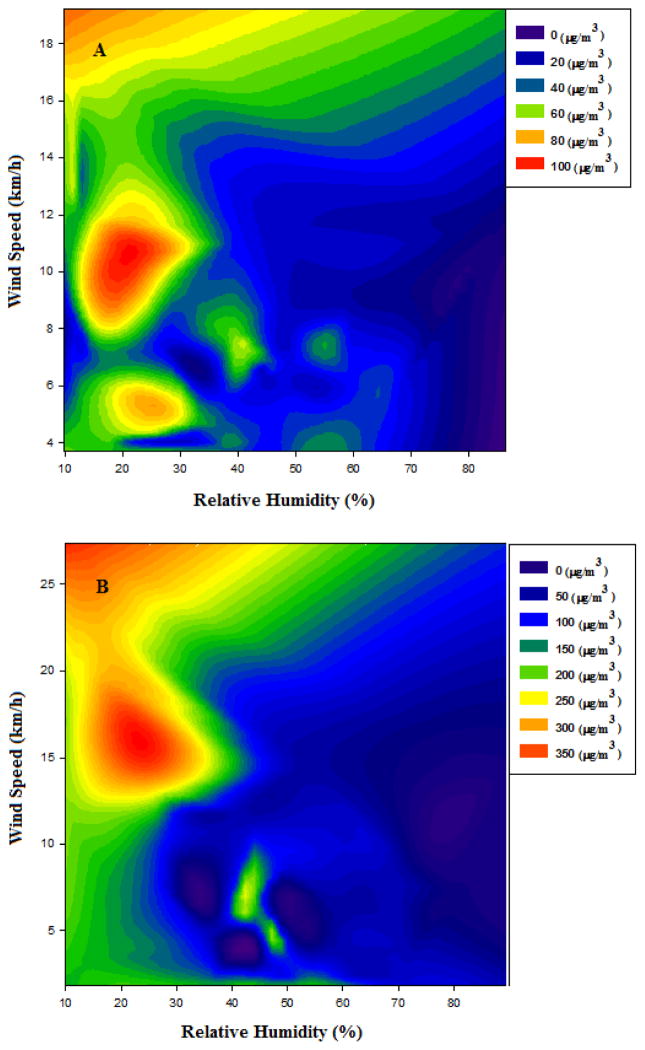
Atmospheric particulate have deleterious impacts on human health. Predicting dust and aerosol emission and transport would be helpful to reduce harmful impacts but, despite numerous studies, prediction of dust events and contaminant transport in dust remains challenging. In this work, we show that relative humidity and wind speed are both determinants in atmospheric dust concentration. Observations of atmospheric dust concentrations in Green Valley, AZ, USA, and Juárez, Chihuahua, México, show that PM10 concentrations are not directly correlated with wind speed or relative humidity separately. However, selecting the data for high wind speeds (>4m/s at 10 m elevation), a definite trend is observed between dust concentration and relative humidity: dust concentration increases with relative humidity, reaching a maximum around 25% and it subsequently decreases with relative humidity. Models for dust storm forecasting may be improved by utilizing atmospheric humidity and wind speed as main drivers for dust generation and transport.

Keywords: Dust emission; PM(10); Relative humidity; Semi-arid; Wind speed.


Figures

Figure 1
Figure 1
Field locations for dust monitoring in Green Valley, AZ, USA. Pecan North and Pecan South are located on the edge of a pecan tree grove and beside a dry river bed; Wastewater is located beside the same river bed; PDEQ represents an urban sample; 10 Mile is approximately 10 miles (16 km) from mining activities; HQ (Santa Rita Experimental Range) represents a natural background site chosen for the region. Annual data were taken from Green Valley Fire. Mining activities for the region are labeled in blue.
Figure 2
Figure 2
Field locations for monitoring in Juárez, Chihuahua, Mexico. PM10 monitoring was performed at the two locations show: Location A is surrounded by paved roads and Location B is surrounded by unpaved roads.
Figure 3
Figure 3
Overall average of PMx for the 9 events during March – May 2011 captured from TSP and Dusttrak observations at the Green Valley sites. The inset shows an expanded version of the plot without the TSP data.
Figure 4
Figure 4
Overall average wind rose for the nine sampling events during March – May 2011 at the Green Valley site.
Figure 5
Figure 5
Wind speed, relative humidity and dust concentration for measurements separated into “Calm”, “Windy”, and “Windy Dusty” events, each containing average of three different measurements, for the Green Valley events. Error bars represent standard deviations of repeat measurements of the same sample.
Figure 6
Figure 6
Wind roses for “Calm”, “Windy”, and “Windy Dusty” events, each corresponding to three different measurements.
Figure 7
Figure 7
PM10 vs. relative humidity (WS>4 m/s) at the Green Valley Fire Station for 2011.
Figure 8
Figure 8
PM10 concentration (μg/m3) contours of relative humidity versus wind speed for Green Valley Fire data.
Figure 9
Figure 9
PM10 concentration (μg/m3) contours compared to relative humidity (%) versus and speed (km/h) from a study in Juárez, Chihuahua Mexico. Location A monitored PM10 near paved roads (top) and Location B monitored near unpaved roads (bottom).

References

    1. Breshears DD, Kirchner TB, et al. Modeling aeolian transport in response to succession, disturbance and future climate: Dynamic long-term risk assessment for contaminant redistribution. Aeolian Res. 2012;3:445–457.
    1. Cheng XL, Wu L, et al. Parameterizations of some important characteristics of turbulent fluctuations and gusty wind disturbances in the atmospheric boundary layer. J Geophys Res-Atmos. 2012;117:D08113. doi: 10.1029/2011JD017191. - DOI
    1. Csavina J, Landázuri A, et al. Metal and metalloid contaminants in atmospheric aerosols from mining operations. Water Air Soil Poll. 2011;221:145–157. - PMC - PubMed
    1. Csavina J, Field J, et al. A review on the importance of metals and metalloids in atmospheric dust and aerosol from mining operations. Sci Total Environ. 2012;433:58–73. - PMC - PubMed
    1. Degobbi C, Lopes F, et al. Correlation of fungi and endotoxin with PM2.5 and meteorological parameters in atmosphere of Sao Paulo. Brazil Atmos Environ. 2011;45:2277–2283.

Publication types

LinkOut - more resources