. 2014 Apr;26(4):1681-1697.
doi: 10.1105/tpc.114.124982. Epub 2014 Apr 25.

Methylcrotonyl-CoA Carboxylase Regulates Triacylglycerol Accumulation in the Model Diatom Phaeodactylum tricornutum

Affiliations

Methylcrotonyl-CoA Carboxylase Regulates Triacylglycerol Accumulation in the Model Diatom Phaeodactylum tricornutum

Feng Ge et al. Plant Cell. 2014 Apr.

Abstract

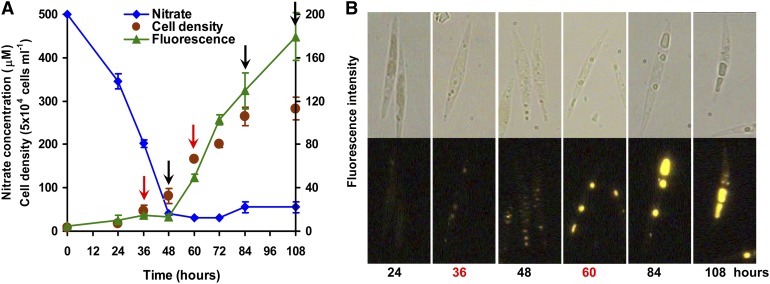
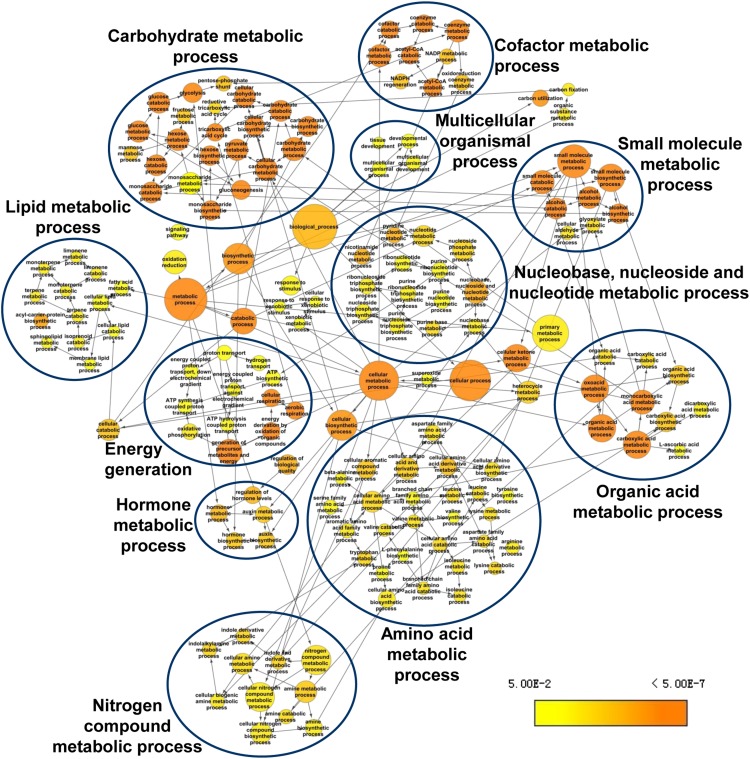
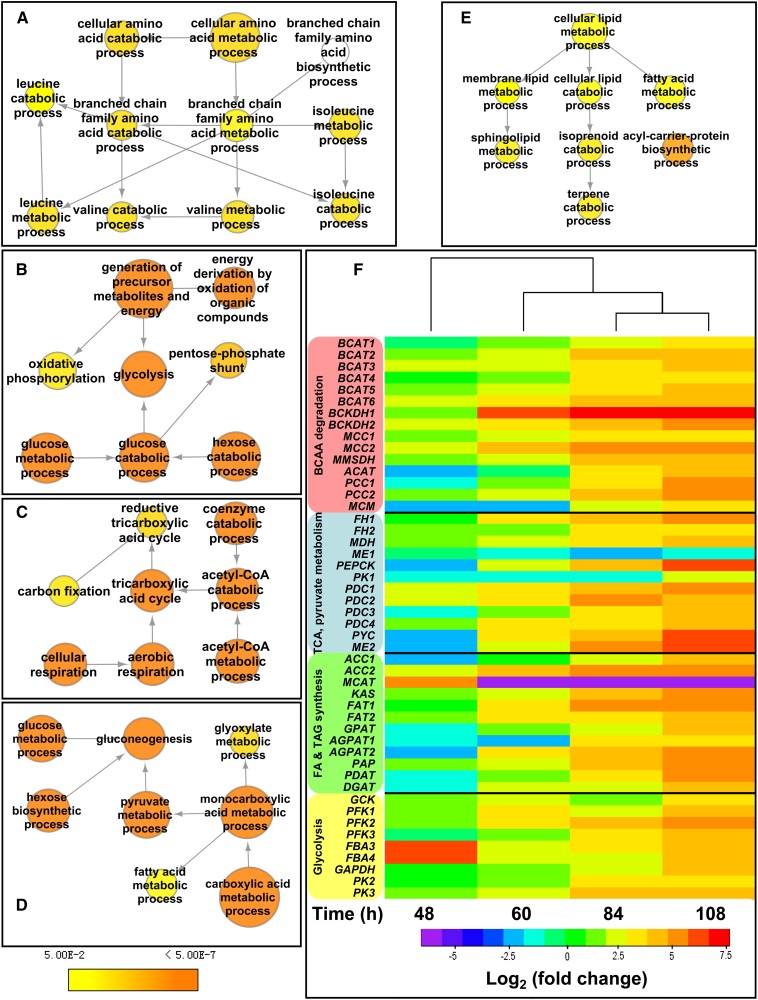
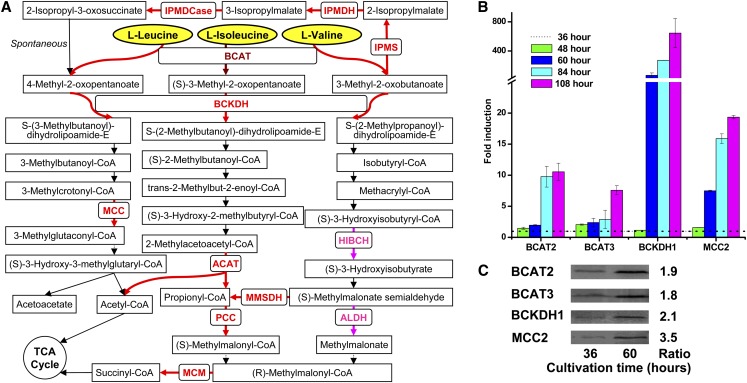
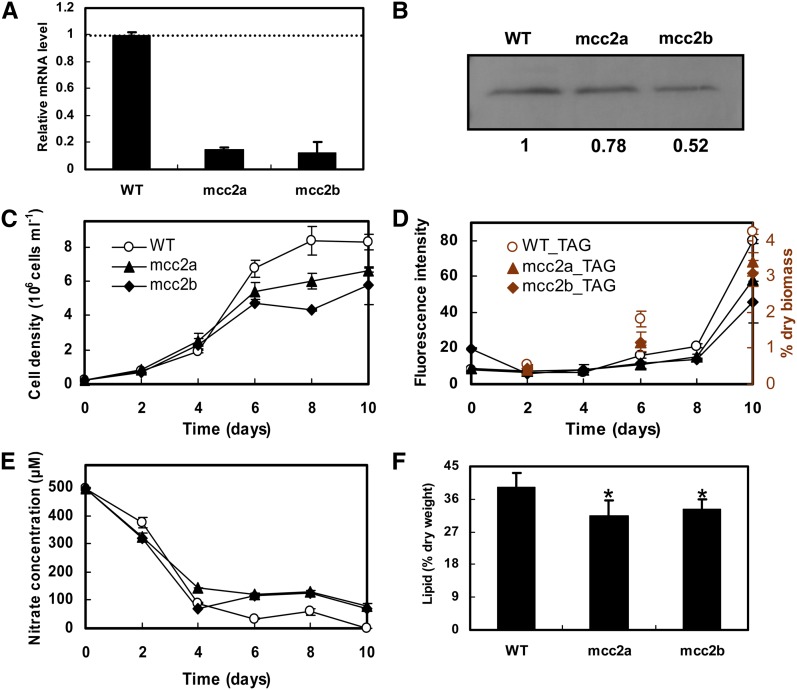
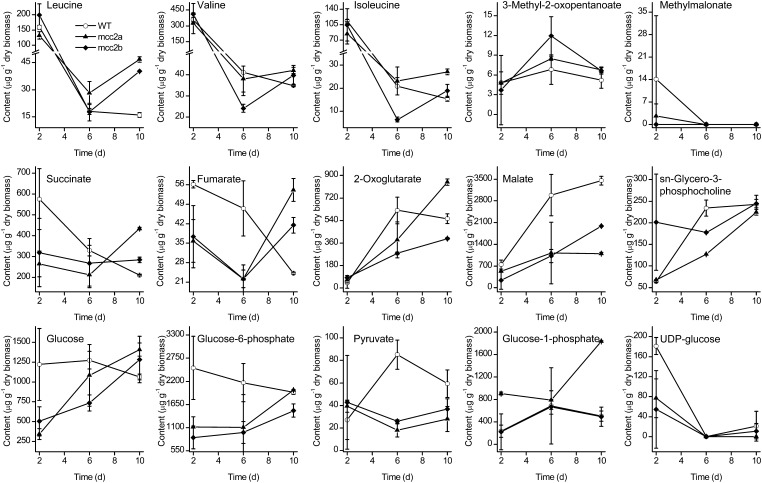
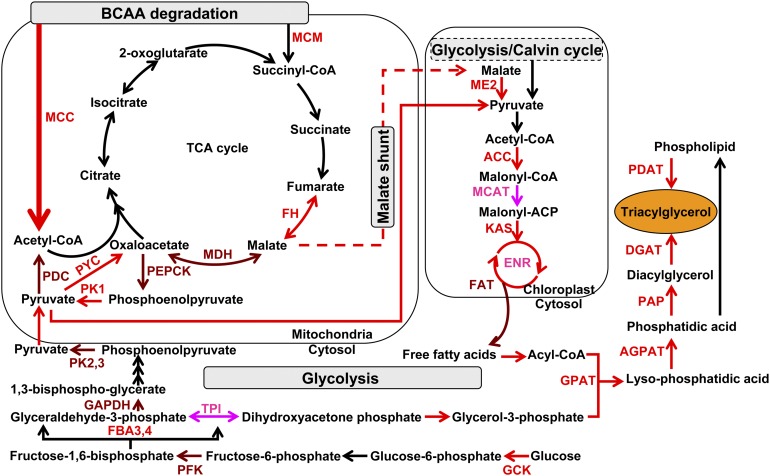
The model marine diatom Phaeodactylum tricornutum can accumulate high levels of triacylglycerols (TAGs) under nitrogen depletion and has attracted increasing attention as a potential system for biofuel production. However, the molecular mechanisms involved in TAG accumulation in diatoms are largely unknown. Here, we employed a label-free quantitative proteomics approach to estimate differences in protein abundance before and after TAG accumulation. We identified a total of 1193 proteins, 258 of which were significantly altered during TAG accumulation. Data analysis revealed major changes in proteins involved in branched-chain amino acid (BCAA) catabolic processes, glycolysis, and lipid metabolic processes. Subsequent quantitative RT-PCR and protein gel blot analysis confirmed that four genes associated with BCAA degradation were significantly upregulated at both the mRNA and protein levels during TAG accumulation. The most significantly upregulated gene, encoding the β-subunit of methylcrotonyl-CoA carboxylase (MCC2), was selected for further functional studies. Inhibition of MCC2 expression by RNA interference disturbed the flux of carbon (mainly in the form of leucine) toward BCAA degradation, resulting in decreased TAG accumulation. MCC2 inhibition also gave rise to incomplete utilization of nitrogen, thus lowering biomass during the stationary growth phase. These findings help elucidate the molecular and metabolic mechanisms leading to increased lipid production in diatoms.


Figures

Figure 1.
Figure 1.
TAG Accumulation and Nitrate Concentration Changes over Time. (A) Time course of cell density, nitrate concentration in culture media, and accumulation of TAGs (fluorescence intensity normalized to cell number) detected by Nile red assay in P. tricornutum. Arrows indicate the time at which samples were prepared for proteomic (red) and quantitative real-time PCR analysis (black and red). (B) Microscopy images (above, bright field; below, Nile red fluorescence) of Nile red–stained cells grown in f/2 (NaNO3 concentration was reduced to 500 μM) enriched artificial seawater medium for 24, 36, 48, 60, 84, or 108 h.
Figure 2.
Figure 2.
GO Term Overrepresentation Analysis of Biological Processes. Overrepresentation analysis of proteins significantly overexpressed during TAG accumulation in P. tricornutum is shown, with respect to their GO terms describing biological processes, analyzed with the Cytoscape plug-in BiNGO 2.4. The enriched GO terms are shown as nodes connected by directed edges that indicate hierarchies and relationships between terms. Node size is proportional to the number of proteins belonging to the functional category. Node color indicates the corrected P value for the enrichment of the term according to the color legend. The enriched GO terms are divided into 11 clusters as indicated according to their biological function. The corrected P < 0.05 was considered to be significant. [See online article for color version of this figure.]
Figure 3.
Figure 3.
Metabolic Pathways That Contribute to TAG Accumulation. (A) to (E) Significantly overrepresented GO terms of upregulated proteins that are closely related to BCAA catabolic process (A), glycolysis (B), TCA cycle (C), pyruvate metabolic process (D), and lipid metabolic process (E). Node color indicates the corrected P value for the enrichment of the term according to the color legend. The corrected P < 0.05 was considered to be significant. (F) Transcript levels of genes encoding components involved in BCAA degradation, TCA cycle, pyruvate metabolism, fatty acid synthesis, TAG synthesis, and glycolysis at 36, 48, 60, 84, or 108 h. Hierarchical clustering of transcriptional fold changes, from triplicate technical replicates of duplicate cultures (n = 2), relative to transcript levels at 36 h. Log2 values > (±) 2 (4-fold) are significant (P < 0.05). BCKDH1, α-subunit of BCKDH; BCKDH2, β-subunit of BCKDH; MCC1, α-subunit of MCC; MCC2, β-subunit of MCC; MMSDH, methylmalonate-semialdehyde dehydrogenase; ACAT, acetyl-CoA C-acyltransferase; PCC, propionyl-CoA carboxylase (PCC1, α-subunit of PCC; PCC2, β-subunit of PCC); MCM, methylmalonyl-CoA mutase; FH, fumarate hydratase; MDH, malate dehydrogenase; ME, malic enzyme (ME1, mitochondrial ME; ME2, plastidial ME); PEPCK, phosphoenolpyruvate carboxykinase; PK, pyruvate kinase (PK1, mitochondrial PK; PK2 and PK3, cytosolic PK); PDC, pyruvate dehydrogenase; PYC, pyruvate carboxylase; ACC, acetyl-CoA carboxylase; KAS, 3-ketoacyl-ACP synthase; FAT, fatty acid acyl ACP thioesterases; GPAT, glycerol-3-phosphate O-acyltransferase; AGPAT, 1-acylglycerol-3-phosphate O-acyltransferase; PAP, phosphatic acid phosphatase; PDAT, phospholipid:diacylglycerol acyltransferase; DGAT, diacylglycerol O-acyltransferase; GCK, glucokinase; PFK, 6-phosphofructokinase; FBA, fructose bisphosphate aldolase (FBA3 and FBA4, cytosolic FBA); GAPDH, glyceraldehyde-3-phosphate dehydrogenase.
Figure 4.
Figure 4.
BCAA Degradation during TAG Accumulation. (A) Pathways of BCAA degradation in P. tricornutum. Overexpressed proteins detected by proteomic analysis are shown in pink, transcriptionally upregulated genes are in red, and the transcriptionally upregulated BCAT, which was also upregulated in the proteomic data, is in brown. HIBCH, 3-hydroxyisobutyryl-CoA hydrolase; ACAT, acetyl-CoA C-acyltransferase; MMSDH, methylmalonate-semialdehyde dehydrogenase; ALDH, aldehyde dehydrogenase; PCC, propionyl-CoA carboxylase; MCM, methylmalonyl-CoA mutase; IPMS, 2-isopropylmalate synthase; IPMDH, isopropylmalate dehydratase; IPMDCase, 3-isopropylmalate dehydrogenase. (B) Transcriptional fold changes of BCAT2, BCAT3, BCKDH1 (α-subunit of BCKDH), and MCC2 (β-subunit of MCC) at 48, 60, 84, or 108 h relative to 36 h. Gene expression levels were normalized to the expression of the histone H4 gene. Error bars represent se of triplicate technical replicates of duplicate cultures (n = 2). (C) Immunoblotting analysis of protein levels of BCAT2, BCAT3, BCKDH1, and MCC2 at 36 and 60 h. Cell lysate aliquots were made and normalized by intracellular protein concentration. Fold increases of protein levels from 36 to 60 h, determined using Image J software, are also shown. Normalization is shown in Supplemental Figure 6.
Figure 5.
Figure 5.
Effect of MCC2 Gene Silencing on TAG Accumulation. Relative mRNA levels of MCC2 (error bars represent se of triplicate technical replicates of duplicate cultures) (A), MCC2 protein levels (B), growth (C), accumulation of TAGs detected by Nile Red assay (fluorescence intensity normalized to cell number) and gas chromatography (D), nitrate utilization (E), and total lipid content (F) of wild-type and two RNAi silenced lines (mcc2a and mcc2b) grown in f/2 (NaNO3 concentration was reduced to 500 μM) enriched artificial seawater medium. mRNA levels, immunoblotting, and lipid content analyses were performed at day 8. Protein concentration was determined using Image J software and normalized to the wild type. Error bars in (C) to (F) represent SE of three biological replicates. An asterisk indicates the values that were determined by the t test to be significantly different (P < 0.05) from the wild type. [See online article for color version of this figure.]
Figure 6.
Figure 6.
Metabolite Content in Wild-Type and Two RNAi Silenced Lines (mcc2a and mcc2b). Cultures were grown in f/2 (NaNO3 concentration was reduced to 500 μM) enriched artificial seawater medium, and metabolites were analyzed at days 2, 6, and 10. Error bars represent se of three biological replicates.
Figure 7.
Figure 7.
Putative Simplified Model of Metabolic Pathways Responsible for TAG Accumulation. Upregulated proteins detected by proteomic analysis are illustrated in pink, transcriptionally upregulated genes in red, and genes detected to be upregulated at both transcript and protein (proteomic) levels in brown. The metabolic processes in which these proteins are involved in subcellular organelles is shown according to KEGG pathway annotation. FH, fumarate hydratase; MDH, malate dehydrogenase; PEPCK, phosphoenolpyruvate carboxykinase; PK, pyruvate kinase (PK1, mitochondrial PK; PK2 and PK3, cytosolic PK); PDC, pyruvate dehydrogenase; PYC, pyruvate carboxylase; ME2, plastidial malic enzyme; ACC, acetyl-CoA carboxylase; MCAT, malonyl-CoA:ACP transacylase; KAS, 3-ketoacyl-ACP synthase; FAT, fatty acid acyl ACP thioesterases; GPAT, glycerol-3-phosphate O-acyltransferase; AGPAT, 1-acylglycerol-3-phosphate O-acyltransferase; PAP, phosphatic acid phosphatase; DGAT, diacylglycerol O-acyltransferase; PDAT, phospholipid:diacylglycerol acyltransferase; GCK, glucokinase; PFK, 6-phosphofructokinase; FBA, fructose bisphosphate aldolase (FBA3 and FBA4, cytosolic FBA); GAPDH, glyceraldehyde-3-phosphate dehydrogenase; ENR, enoyl-acyl carrier protein reductase; TPI, triose-phosphate isomerase.

References

    1. Aguirre A.-M., Bassi A., Saxena P. (2013). Engineering challenges in biodiesel production from microalgae. Crit. Rev. Biotechnol. 33: 293–308 - PubMed
    1. Allen A.E., Dupont C.L., Oborník M., Horák A., Nunes-Nesi A., McCrow J.P., Zheng H., Johnson D.A., Hu H., Fernie A.R., Bowler C. (2011). Evolution and metabolic significance of the urea cycle in photosynthetic diatoms. Nature 473: 203–207 - PubMed
    1. Allen A.E., Laroche J., Maheswari U., Lommer M., Schauer N., Lopez P.J., Finazzi G., Fernie A.R., Bowler C. (2008). Whole-cell response of the pennate diatom Phaeodactylum tricornutum to iron starvation. Proc. Natl. Acad. Sci. USA 105: 10438–10443 - PMC - PubMed
    1. Bantscheff M., Lemeer S., Savitski M.M., Kuster B. (2012). Quantitative mass spectrometry in proteomics: critical review update from 2007 to the present. Anal. Bioanal. Chem. 404: 939–965 - PubMed
    1. Bender S.J., Parker M.S., Armbrust E.V. (2012). Coupled effects of light and nitrogen source on the urea cycle and nitrogen metabolism over a diel cycle in the marine diatom Thalassiosira pseudonana. Protist 163: 232–251 - PubMed

LinkOut - more resources