. 2014 Sep;114(4):853-62.
doi: 10.1093/aob/mcu062.

Quantitative assessment of automatic reconstructions of branching systems obtained from laser scanning

Quantitative assessment of automatic reconstructions of branching systems obtained from laser scanning

Frédéric Boudon et al. Ann Bot. 2014 Sep.

Abstract

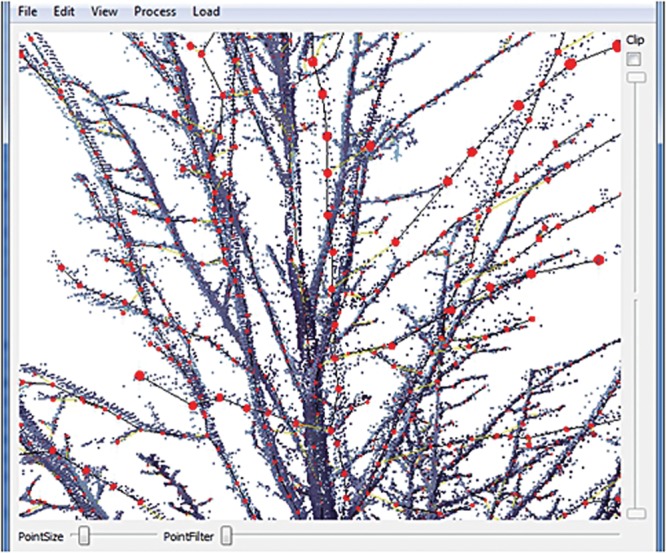
Background and aims: Automatic acquisition of plant architecture is a major challenge for the construction of quantitative models of plant development. Recently, 3-D laser scanners have made it possible to acquire 3-D images representing a sampling of an object's surface. A number of specific methods have been proposed to reconstruct plausible branching structures from this new type of data, but critical questions remain regarding their suitability and accuracy before they can be fully exploited for use in biological applications.

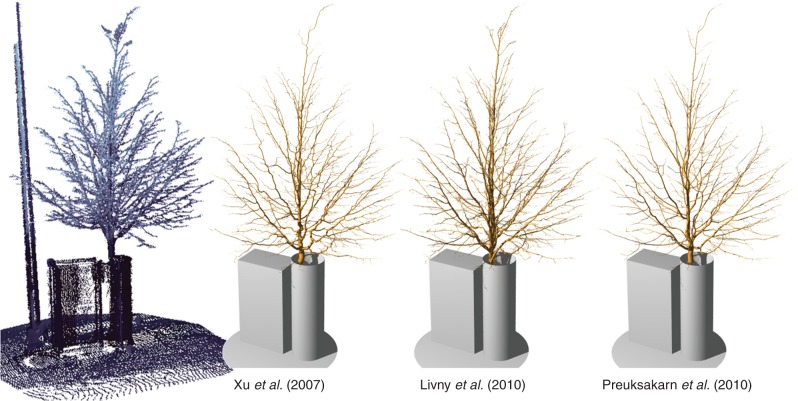
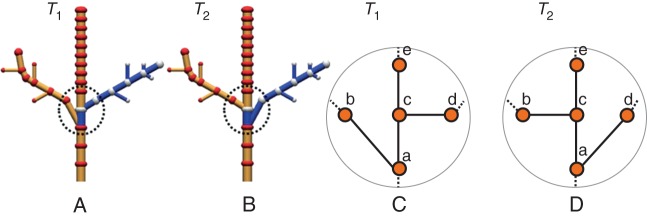
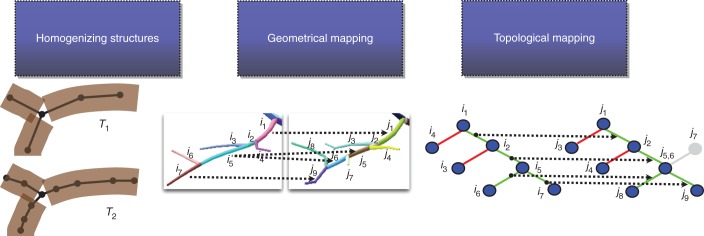
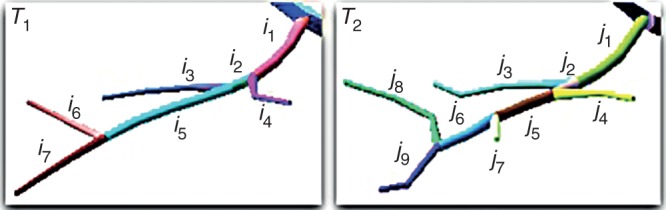
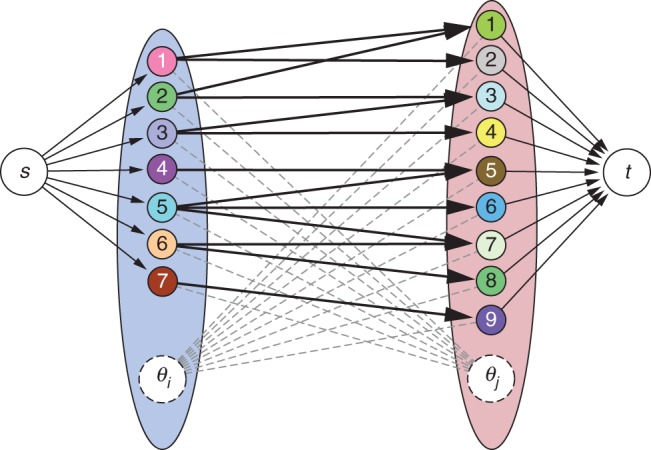
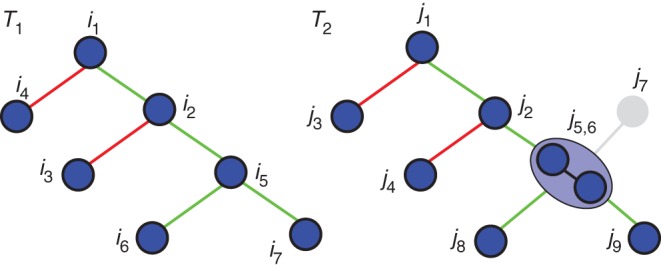
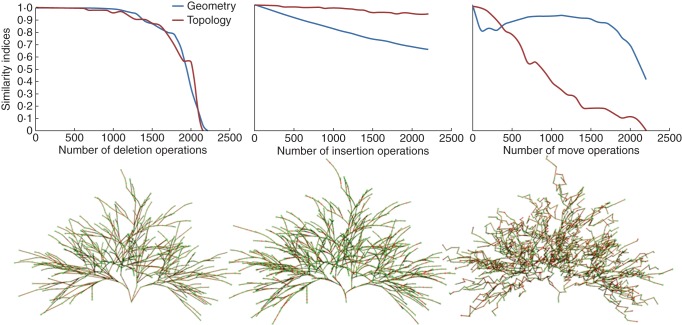
Methods: In this paper, an evaluation framework to assess the accuracy of tree reconstructions is presented. The use of this framework is illustrated on a selection of laser scans of trees. Scanned data were manipulated by experienced researchers to produce reference tree reconstructions against which comparisons could be made. The evaluation framework is given two tree structures and compares both their elements and their topological organization. Similar elements are identified based on geometric criteria using an optimization algorithm. The organization of these elements is then compared and their similarity quantified. From these analyses, two indices of geometrical and structural similarities are defined, and the automatic reconstructions can thus be compared with the reference structures in order to assess their accuracy.

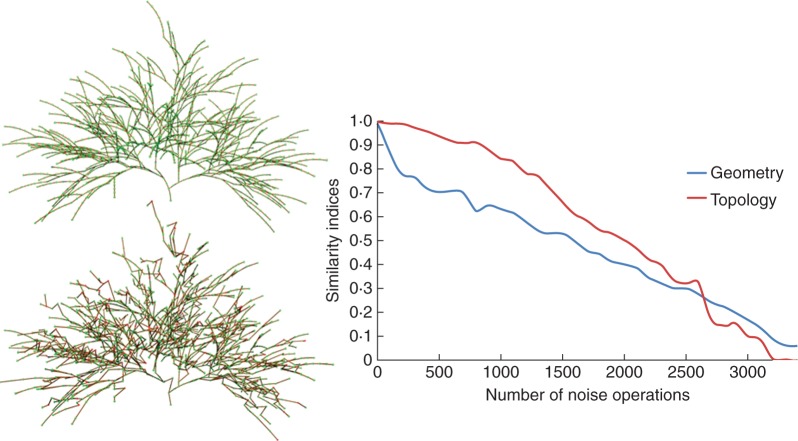
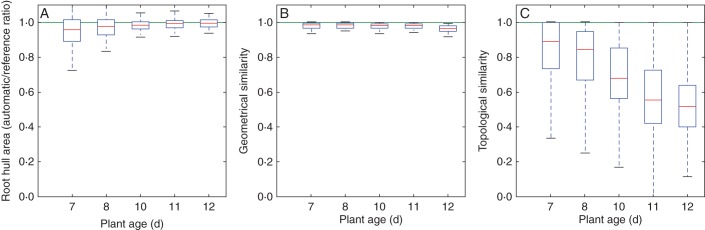
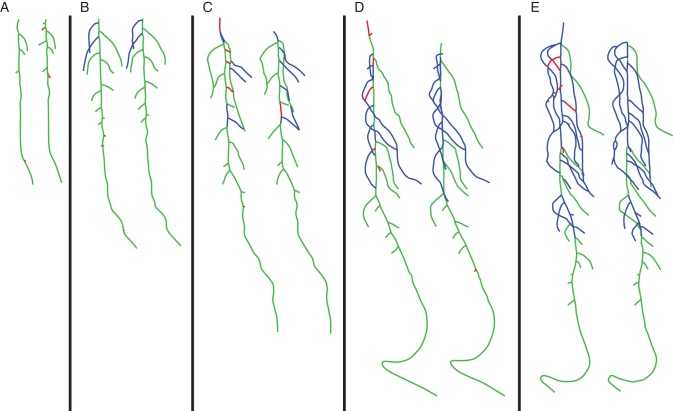
Key results: The evaluation framework that was developed was successful at capturing the variation in similarities between two structures as different levels of noise were introduced. The framework was used to compare three different reconstruction methods taken from the literature, and allowed sensitive parameters of each one to be determined. The framework was also generalized for the evaluation of root reconstruction from 2-D images and demonstrated its sensitivity to higher architectural complexity of structure which was not detected with a global evaluation criterion.

Conclusions: The evaluation framework presented quantifies geometric and structural similarities between two structures. It can be applied to the characterization and comparison of automatic reconstructions of plant structures from laser scanner data and 2-D images. As such, it can be used as a reference test for comparing and assessing reconstruction procedures.


Figures

Fig. 1.
Fig. 1.
A scanned tree and its reconstructions according to different methods found in the literature.
Fig. 2.
Fig. 2.
The software tool used by experienced researchers to create structures from laser data. Red spheres represent nodes of the structure. Sliders control the location and the size of the laser point display. The user can edit the plant structure by adding, deleting, moving or changing the properties of nodes.
Fig. 3.
Fig. 3.
A comparison of two structures with a high degree of similarity. The only difference is the location of the branching point of the two laterals branches. Due to this simple inversion, the ancestor relationships between branching structures is not preserved. Using the comparison method of Ferraro and Godin (2000), the two right-hand branches are found to be significantly different. The cost used to parameterize the method for the substitution is set equal to the distance between positions of the nodes. Deletion and insertion costs are set to three times the average size of a node. (A, B) The two compared trees. The blue parts of the structures are not matched. (C, D) Zoom on the branches' connections on the trunk. A simple inversion of the connections at nodes a and c is introduced between T1 and T2.
Fig. 4
Fig. 4
Our comparison framework makes it possible to estimate both geometrical and topological differences between structures. In a first step, both compared structure scales are homogenized. The elements of these structures are then compared based on geometric criteria to find similar elements. Finally, the topology of these elements is compared to quantify the similarity of their organization.
Fig. 5
Fig. 5
Example of geometrical comparison between elements of two structures.
Fig. 6.
Fig. 6.
The optimal flow formulation of the mapping of the inter-ramification branch units (IBUs) of tree T1 (left) onto the IBUs of tree T2 (right). s represents the source and t the sink.
Fig. 7.
Fig. 7.
A comparison of the topologies of the two branching structures of Fig. 5. The graphs are first simplified, with j7 being removed and j5 and j6 merged. Finally, all edges of T1 are compared with their counterparts in T2. For instance, the edge linking i1 and i2 has its counterpart between j1 and j2 and thus is said to be preserved and is represented in green. However, the edge between i1 and i4 has no counterpart between j1 and j4 and is represented in red.
Fig. 8.
Fig. 8.
The geometrical and topological similarity assessed using indices DG (geometry) and DT (topology) between a reference structure and the same structure on which a number of random noise operations has been performed. The reference structure is shown at top left, and the structure after 1000 random noise operations is below it. The graph shows the values of DG and DT as functions of the different levels of noise.
Fig. 9.
Fig. 9.
An evaluation of the effect of each type of noise operation on the similarity indices. Deletion, insertion and move noise operations were tested separately, as indicated in the graph labels. The values of DG (geometry) and DT (topology) as a function of the number of performed noise operations are shown in the graphs, while the images illustrates the noise structures after 1000 operations.
Fig. 10.
Fig. 10.
A quantitative evaluation of the reconstructed root structures in comparison with reference structures produced by experienced researchers. (A) The ratio of the hull area of the roots from automatically extracted structures and of roots of reference structures. (B) The geometrical similarity. (C) The topological similarity. Box-and-whisker plots are presented, and all plots are grouped by plant age.
Fig. 11.
Fig. 11.
Five examples of the comparison of automatic root system reconstruction (left) and their respective reference structures (right), highlighting geometrical errors in red and topological errors in blue. From left to right, the root systems are 7, 8, 10, 11, and 12 d old.

References

    1. Alexa M, Behr J, Cohen-or D, Fleishman S, Levin D, Silva CT. Computing and rendering point set surfaces. IEEE Transactions on Visualization and Computer Graphics. 2003;9:3–15.
    1. Côté JF, Widlowski JL, Fournier RA, Verstraete MM. The structural and radiative consistency of three-dimensional tree reconstructions from terrestrial lidar. Remote Sensing of Environment. 2009;113:1067–1081.
    1. Diener J, Nacry P, Perin C, et al. An automated image-processing pipeline for high-throughput analysis of root architecture in OpenAlea. In: Sievänen R, Nikinmaa E, Godin C, Lintunen A, Nygren P, editors. Proceedings of the 7th International Workshop on Functional–Structural Plant Models. 2013. pp. 85–87. Saariselkä, Finland, 9–14 June 2013.
    1. Edmonds J, Karp RM. Theoretical improvements in algorithmic efficiency for network flow problems. Journal of the ACM. 1972;19:248–264.
    1. Ferraro P, Godin C. A distance measure between plant architectures. Annals of Forest Science. 2000;57:445–461.

Publication types