. 2014 Apr 28:5:3750.
doi: 10.1038/ncomms4750.

KCNE1 divides the voltage sensor movement in KCNQ1/KCNE1 channels into two steps

Affiliations

KCNE1 divides the voltage sensor movement in KCNQ1/KCNE1 channels into two steps

Rene Barro-Soria et al. Nat Commun. .

Abstract

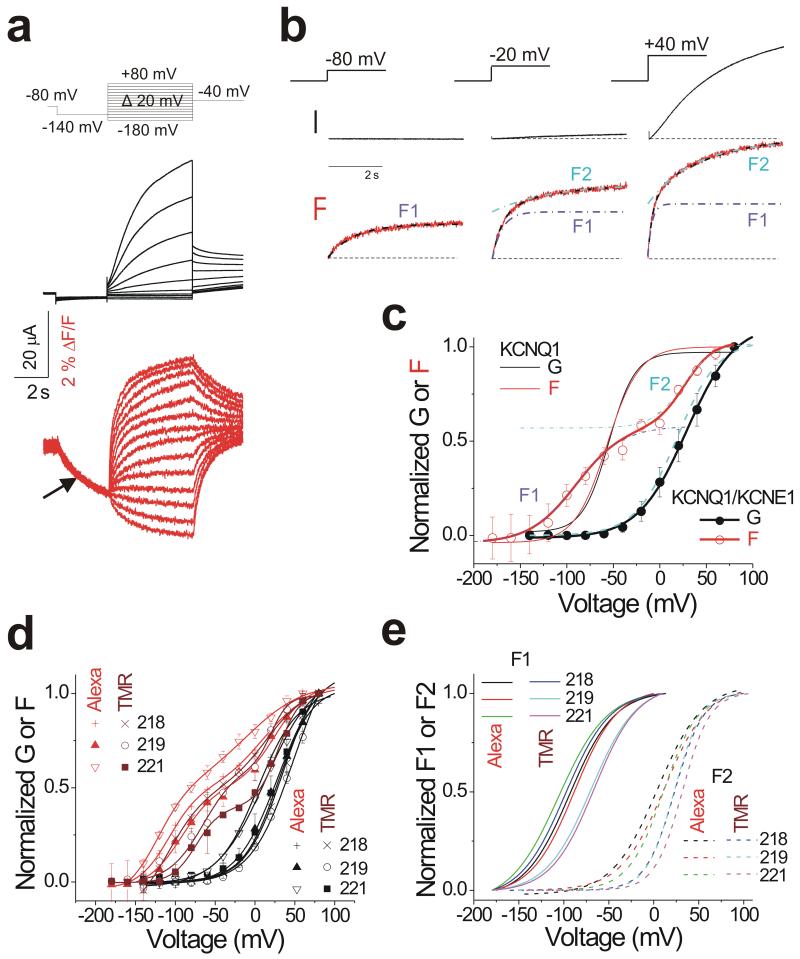
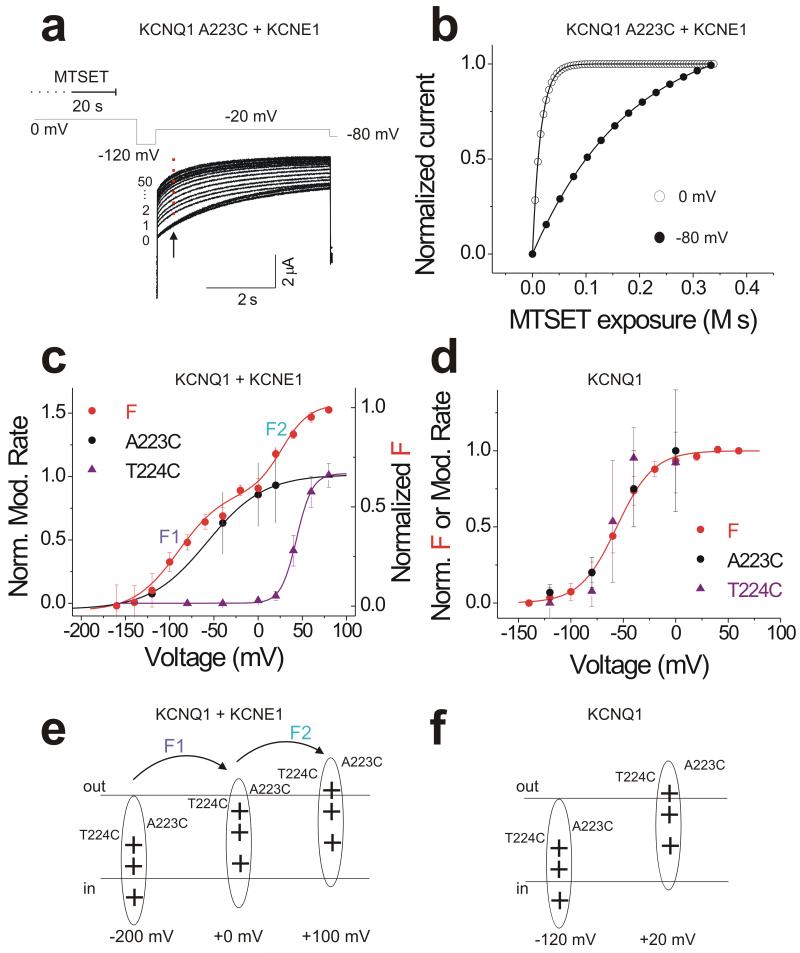
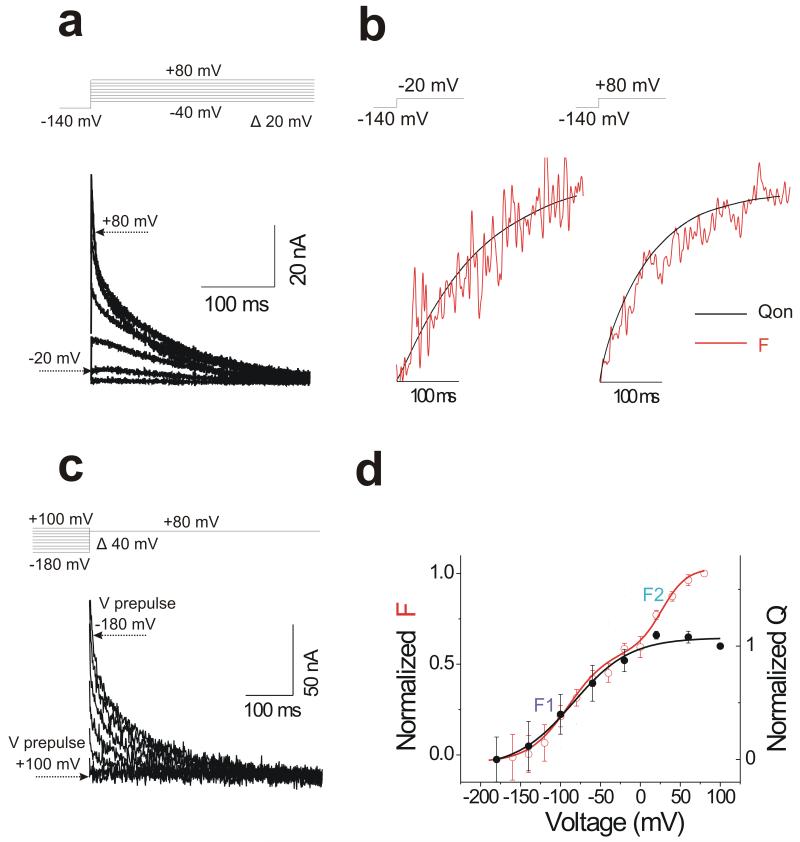
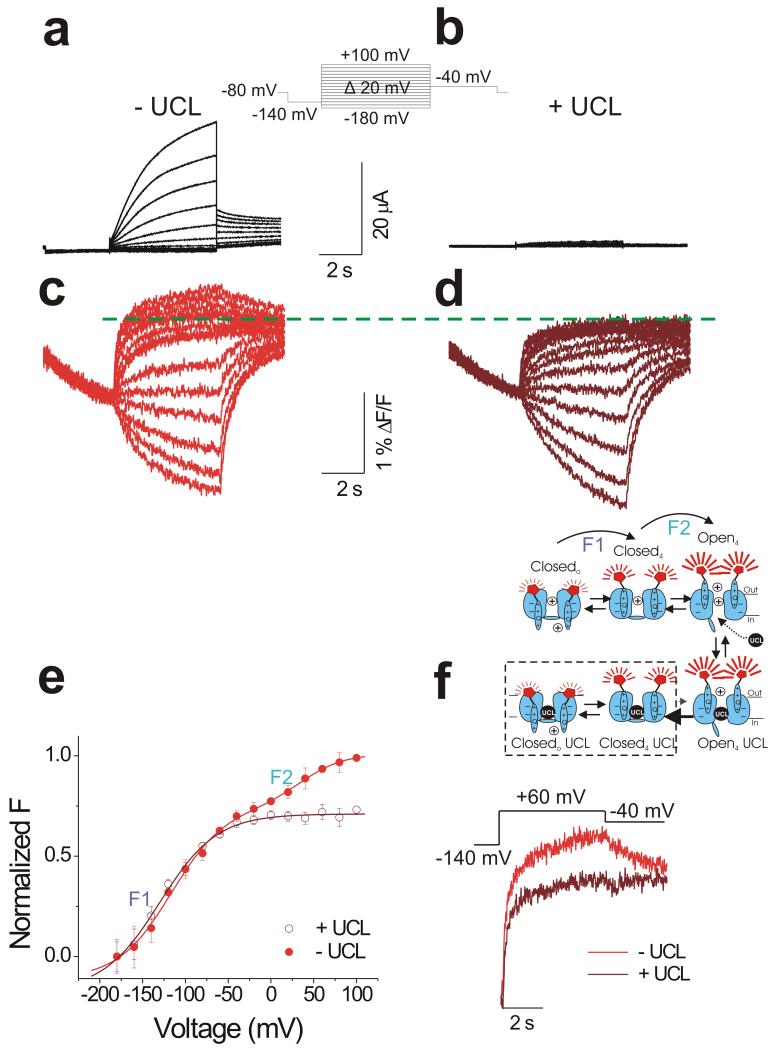
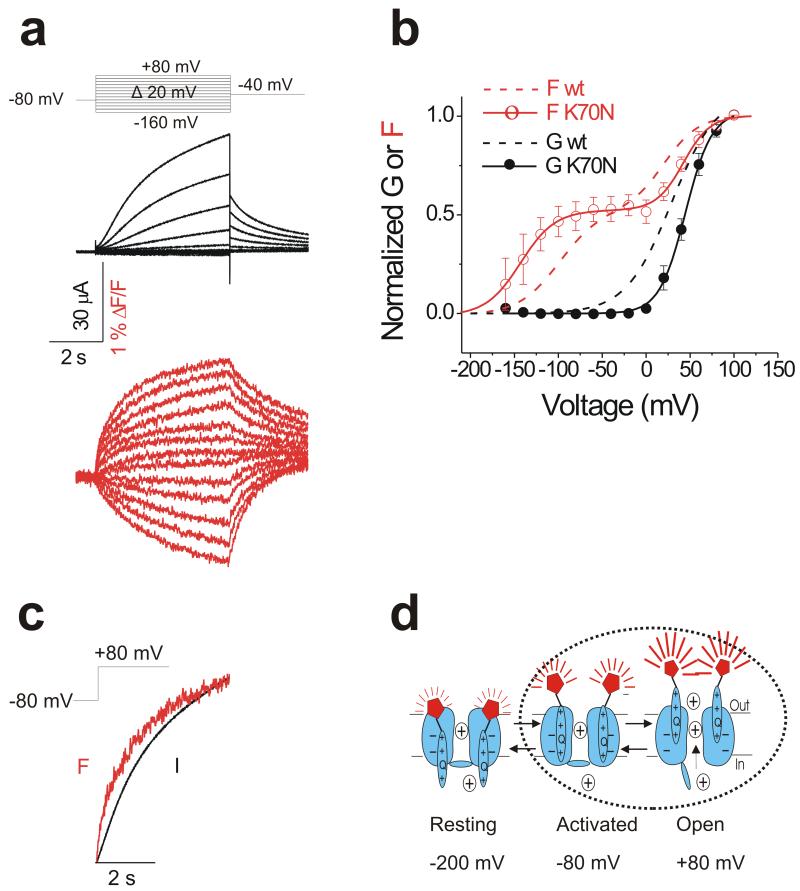
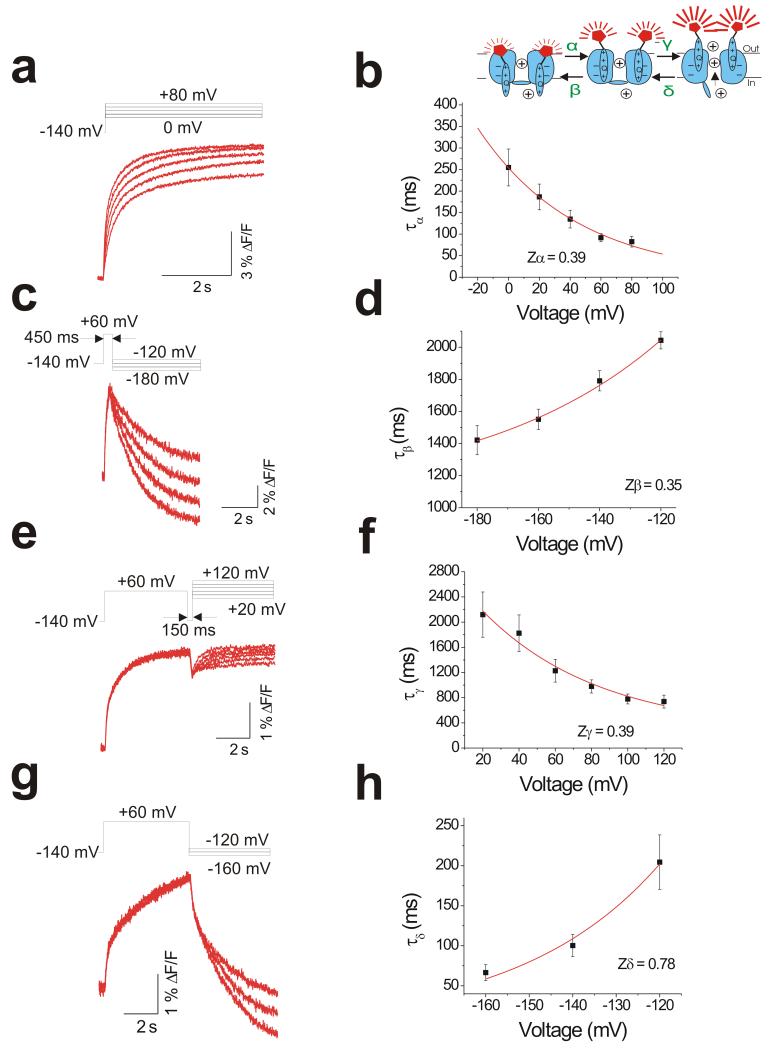
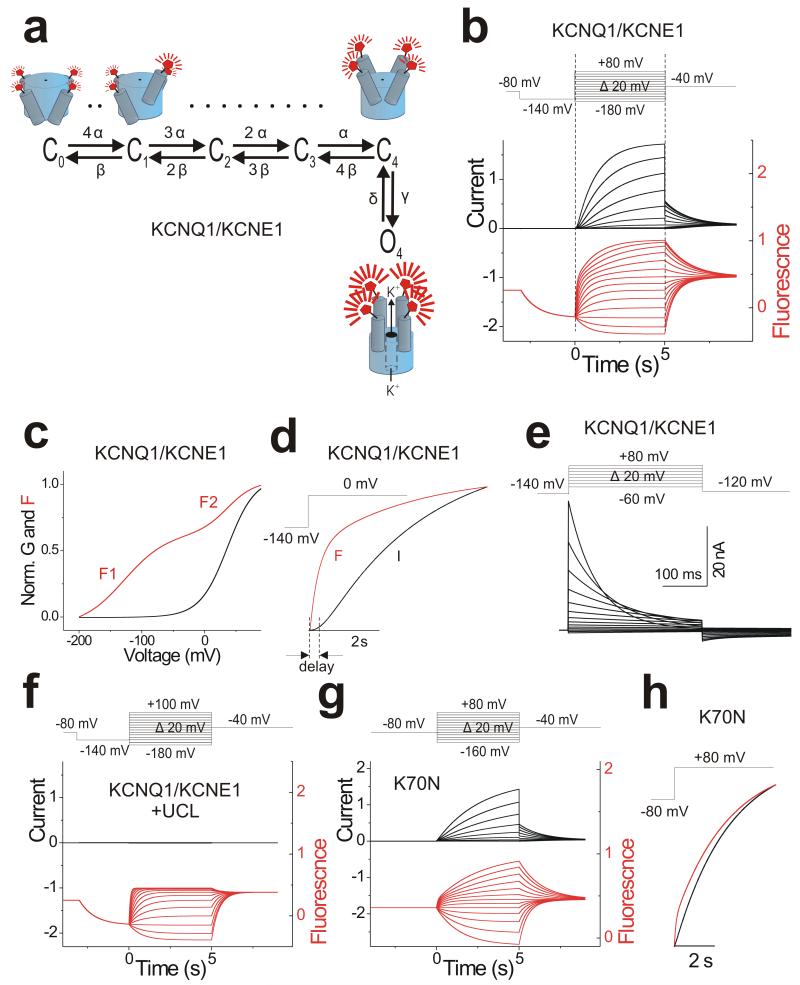
The functional properties of KCNQ1 channels are highly dependent on associated KCNE-β subunits. Mutations in KCNQ1 or KCNE subunits can cause congenital channelopathies, such as deafness, cardiac arrhythmias and epilepsy. The mechanism by which KCNE1-β subunits slow the kinetics of KCNQ1 channels is a matter of current controversy. Here we show that KCNQ1/KCNE1 channel activation occurs in two steps: first, mutually independent voltage sensor movements in the four KCNQ1 subunits generate the main gating charge movement and underlie the initial delay in the activation time course of KCNQ1/KCNE1 currents. Second, a slower and concerted conformational change of all four voltage sensors and the gate, which opens the KCNQ1/KCNE1 channel. Our data show that KCNE1 divides the voltage sensor movement into two steps with widely different voltage dependences and kinetics. The two voltage sensor steps in KCNQ1/KCNE1 channels can be pharmacologically isolated and further separated by a disease-causing mutation.


Figures

Figure 1
Figure 1. KCNE1 splits the voltage sensors movement of KCNQ1 into two components
(a) Representative current (black) and fluorescence (red) traces from KCNQ1/KCNE1 channels for the indicated voltage protocol (top). (b) Current (black) and fluorescence (red) in response to indicated test potentials for 5 s from −140 mV. The fluorescence traces are fit by a single exponential curve for the −80 mV step and a double exponential curve for the steps to −20 mV and +40 mV (black dashed line). The fast (purple dashed-dotted lines) and slow (cyan dashed-dotted lines) exponential curves of the double exponential fits are shown separately, overlaying the early and late part of the data, respectively. (c) Normalized G(V) (filled black circle and black line from a Boltzmann fit) and F(V) (open red circle and red line from a double Boltzmann fit) of recordings from KCNQ1/KCNE1 channels. The first (purple dashed-dotted lines) and the second (cyan dashed-dotted lines) Boltzmann curves of the double Boltzmann fits are shown separately, overlaying the data at negative and positive voltages, respectively. Data are mean ± SEM; n= 7. Cyan dashed line represents the second fluorescence component normalized between 0 and 1 for comparison with the G(V) for KCNQ1/KCNE1 (thick black line). Thin lines show the G(V) (black) and F(V) (red) curves of KCNQ1 expressed alone for comparison. F1 and F2 represent the first and second fluorescence components (voltage sensor movements), respectively. The midpoints of activation for the fits are: G1/2 = 28.8 ± 2.4 mV, F11/2 = −97.4 ± 7.05 mV, F21/2 = 23.0 ± 7.2 mV; See Methods. (d) Normalized G(V)s (black lines from a Boltzmann fit) and F(V)s (red or wine lines from a double Boltzmann fit) of recordings from KCNQ1/KCNE1 channels with positions 218, 219 and 221 (in S3-S4) mutated to cysteine (one at a time) and labeled with the fluorophores Alexa-488Maleimide (red) or TMRM (wine). Data are mean ± SEM; n= 4-7. (e) Normalized F1(V)s and F2(V)s (solid and dashed lines from Boltzmann fit, respectively) from d.
Figure 2
Figure 2. S4 residue accessibility shows two components of S4 movement in KCNQ1/KCNE1 channels
(a) Current in response to a −20 mV voltage step before (trace 0) and during (traces 1-50) membrane-impermeable thiol reagent MTSET application on KCNQ1/KCNE1 A223C channels. External MTSET is applied at 0 mV for 20 s and then washed away for 12 s, before the cell is hyperpolarized to −120 mV for 12 s, as indicated by the voltage protocol (See Supplementary Figure 2 for details). (b) MTSET modification rates at 0 mV and −80 mV using the current amplitudes measured at the arrow in a. (c-d) Normalized voltage dependence of the modification rate for MTSET to residues 223C (black circle) and 224C (purple triangle) in (c) KCNQ1/KCNE1 and (d) KCNQ1 channels. Data are mean ± SEM for 5 to 8 cells in each group. Normalized F(V)(red) is shown for comparison. (e-f) Cartoon models depicting voltage sensor movement in two steps in (e) KCNQ1/KCNE1 channels and in one step (f) KCNQ1 channel alone, respectively.
Figure 3
Figure 3. Gating currents in KCNQ1/KCNE1 channels follows the first fluorescence component
(a) Representative gating current from KCNQ1/KCNE1 channels using the voltage protocol indicated (top). (b) Normalized fluorescence (red) and the integrated gating charge (black) QON in response to −20 mV and +80 mV pulses for 300 ms. (c) Representative gating current from KCNQ1/KCNE1 channels using a prepulse protocol by stepping to voltages between −180 mV to +100 mV for 5 s, before measuring the gating currents in response to a fixed voltage step to +80 mV. Each prepulse moves different amount of gating charge (0 to Qmax according to the Q(V)) and the remaining gating charge Qmeasured (= Qmax-Q(V)) is moved during the following pulse to +80 mV. (d) Normalized Q(V) (solid black circle and black line from a Boltzmann fit) measured from experiments as in c. Data are mean ± SEM; n = 3. The Q(V) was calculate from the integrated gating currents, Qmeasured(V), in c during the +80mV step as Q(V) = Qmax −Qmeasured(V). Normalized F(V) as in Fig. 1c (open red circle and red line from a double Boltzmann fit) is shown for comparison. Q1/2 = −84.2 ± 9.8 mV; See Figure 1c for F11/2 and F21/2 respectively. Note that Q(V) overlaps the first fluorescence component F1 of the F(V) in KCNQ1/KCNE1 channels.
Figure 4
Figure 4. UCL 2077 isolated the first component of the fluorescence change
Representative current (a-b) and fluorescence (c-d) traces from KCNQ1/KCNE1 channels before (a and c) and during (b and d) extracellular application of UCL 2077 (UCL 2077 is lipid permeable). Cells are held at −80 mV and prepulsed to −140 mV for 3 s before stepping to potentials between −180 mV and +100 mV in 20-mV intervals for 5 s, followed by pulse to −40 mV for 5 s to record tail currents. Green dashed line is shown to denote the absence of the second fluorescence component during application of UCL 2077. (e) Normalized F(V) of recordings from KCNQ1/KCNE1 channels before (filled red circle) and during (open wine red circle) application of UCL2077. Data are mean ± SEM; n = 5. (f) Time course of fluorescence in response to a +60 mV pulse for 5 s before (red) and during (wine red) application of UCL 2077. (Inset) Cartoon consistent with the effect of UCL 2077 on KCNQ1/KCNE1 channel gating. Once the channel opens, the open-channel blocker UCL 2077 access its binding site in the pore. UCL 2077 promotes gate closing by binding to the S6 gate. The first fluorescence component is not affected by UCL 2077 binding (dashed square), but the second S4 movement and channel opening are inhibited.
Figure 5
Figure 5. K70N in KNCE1 farther separates the two voltage sensor movements of KCNQ1
(a) Representative current (black) and fluorescence (red) traces from KCNQ1 channel coexpressed with KCNE1 K70N mutant in response to the indicated protocol (top). (b) Normalized G(V) (filled black circle and black line from a Boltzmann fit) and F(V) (open red circle and red line from a double Boltzmann fit) of recordings from KCNQ1/KCNE1 K70N channels. Data are mean ± SEM; n= 7. Dashed lines represent wild type KCNQ1/KCNE1 G(V) (black) and F(V) (red) curves for comparison. K70N G1/2 = 44.8 ± 0.9, K70N F11/2 = −143.0 ± 13.0 mV, K70N F21/2 = 42.3 ± 2.6 mV; See Fig. 1c for wt F11/2 and F21/2. (c) Time course of current (black) and fluorescence (red) in response to + 80 mV pulse for 5 s. (d) Cartoon of KCNQ1/KCNE1 K70N gating. At −80 mV, K70N channels are mainly in the activated closed state, so a depolarization from −80 mV will only show mainly the slow fluorescence component that correlates with channel opening.
Figure 6
Figure 6. Isolating rate constants in KCNQ1/KCNE1 channels by VCF protocols
(a, c, e and g) Representative fluorescence traces in response to four different voltage protocols (top) to estimate: (a) rate α, (c) rate β, (e) rate γ, and (g) rate δ. (b, d, f and h) Voltage dependence of the time constant τ (which approximate (b) 1/α, (d) 1/β, (f) 1/γ, and (h) 1/δ) from data recorded as in a, c, e, and g respectively. τβ and τγ, were determined by fitting traces as shown in c and e with a single exponential. τα, and τδ were determined by fitting traces as shown in a and g with a double exponential and using the fast time constant. Data in b, d, f, and h were fitted with τ(V)= τ(0)/exp(−zFV/RT). Data in b, d, f, and h are mean ± SEM; n = 4-6. (Inset) Cartoon representing a model of KCNQ1/KCNE1 channel gating with the respective rate constants.
Figure 7
Figure 7. Model for KCNQ1/KCNE1 channel gating
(a) A 6-state allosteric gating scheme for KCNQ1/KCNE1 channels. Horizontal transitions represent independent S4 movements that increase the fluorescence to an intermediate level. The vertical transition represents concerted channel opening with a concomitant additional fluorescence increase. Cartoon shows KCNQ1 channel labeled with a fluorophore on S3-S4 with all four voltage sensors in the resting state (C0), with one (C1), or four (C4) voltage sensor activated without channel opening (top) that is followed by a concerted conformational change of all four S4s associated with channel opening (O4) (bottom). (b) Model simulation of current (black) and fluorescence (red) for KCNQ1/KCNE1 channel using the indicated voltage protocol (top). Note that all parameters in the model are determined by the estimates of the different rate constants and their voltage dependences from Figure 6 (Supplementary Table 1). Current and fluorescence traces were simulated using Berkeley Madonna (Berkeley, CA). (c) Simulated G(V) and F(V) curves for KCNQ1/KCNE1 channels from simulation in b. (d) Model simulation for activation time course of current (black) and fluorescence (red) at 0 mV (from b) in KCNQ1/KCNE1 channels. (e) Model simulation of gating currents in KCNQ1/KCNE1 channels using the indicated voltage protocol (top) and same parameters as in b. (f) Model simulation of current (black) and fluorescence (red) for KCNQ1/KCNE1 channel in the presence of UCL 2077 using the indicated voltage protocol (top). Same parameters as in (b), except that γ = 0 to prevent channel opening. (g) Model simulation of current (black) and fluorescence (red) from KCNQ1/KCNE1 K70N channels using the indicated voltage protocol (top). Same parameters as in b, except that β and δ are slowed down compared to wild type to shift F1 by −40 mV and F2 by +20 mV as in Figure 5b. (h) Model simulation for activation time course of current (black) and fluorescence (red) at +80 mV (from g) in KCNQ1/KCNE1 K70N channels.

Similar articles

Cited by

References

    1. Hille B. Ion Channels of Excitable Membranes. Sinauer Associates, INC; Sunderland, MA: 2001.
    1. Sun X, Zaydman MA, Cui J. Regulation of Voltage-Activated K(+) Channel Gating by Transmembrane beta Subunits. Front Pharmacol. 2012;3:63. - PMC - PubMed
    1. Jespersen T, Grunnet M, Olesen SP. The KCNQ1 potassium channel: from gene to physiological function. Physiology (Bethesda) 2005;20:408–16. - PubMed
    1. Nerbonne JM, Kass RS. Molecular physiology of cardiac repolarization. Physiol Rev. 2005;85:1205–53. - PubMed
    1. Moss AJ, Kass RS. Long QT syndrome: from channels to cardiac arrhythmias. J Clin Invest. 2005;115:2018–24. - PMC - PubMed

Publication types

MeSH terms

LinkOut - more resources