. 2014 Aug;21(8):1275-89.
doi: 10.1038/cdd.2014.48. Epub 2014 Apr 25.

ARHI (DIRAS3) induces autophagy in ovarian cancer cells by downregulating the epidermal growth factor receptor, inhibiting PI3K and Ras/MAP signaling and activating the FOXo3a-mediated induction of Rab7

Affiliations

ARHI (DIRAS3) induces autophagy in ovarian cancer cells by downregulating the epidermal growth factor receptor, inhibiting PI3K and Ras/MAP signaling and activating the FOXo3a-mediated induction of Rab7

Z Lu et al. Cell Death Differ. 2014 Aug.

Abstract

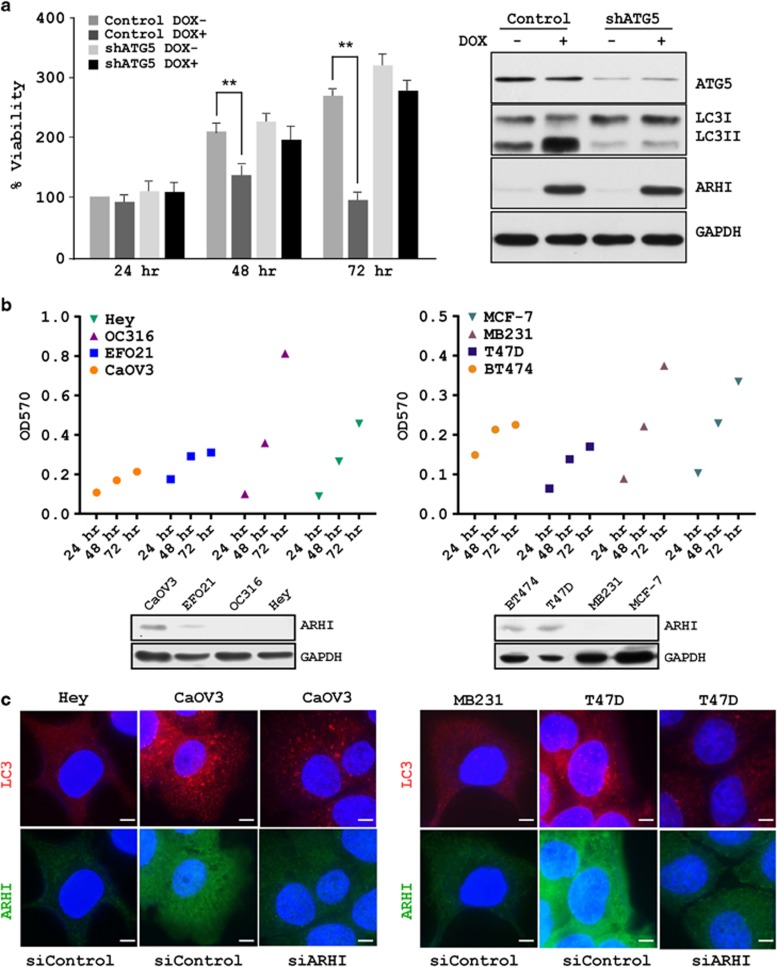
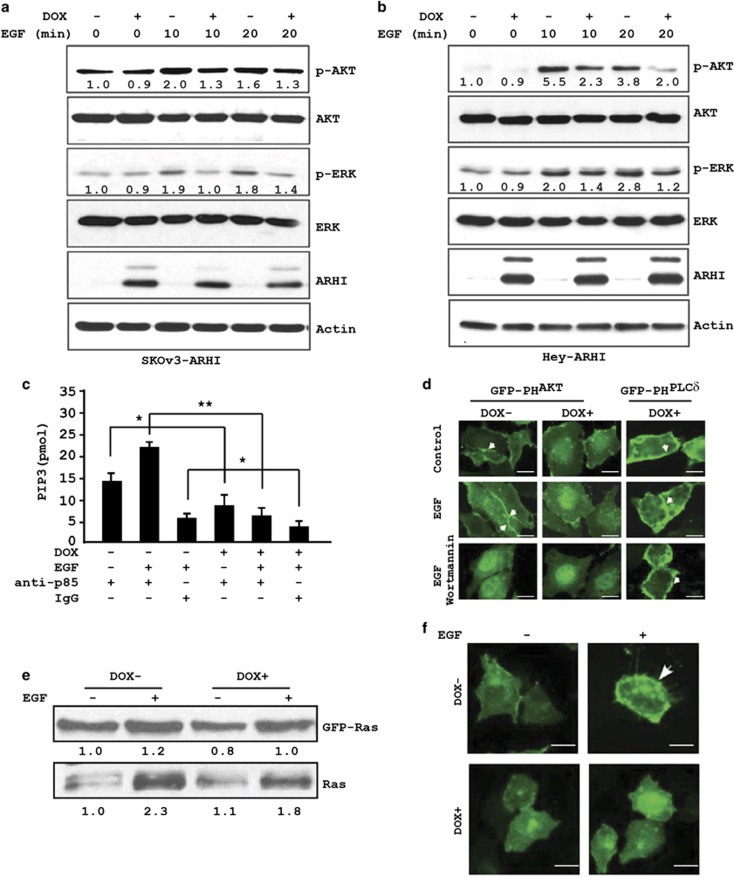
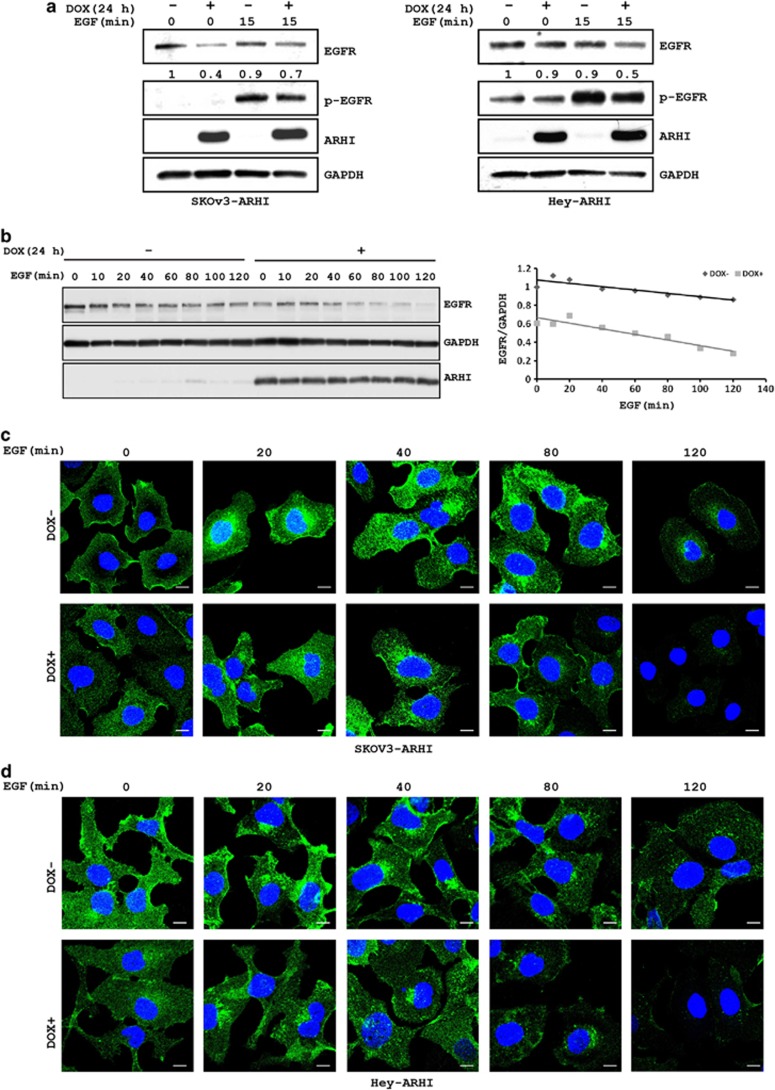
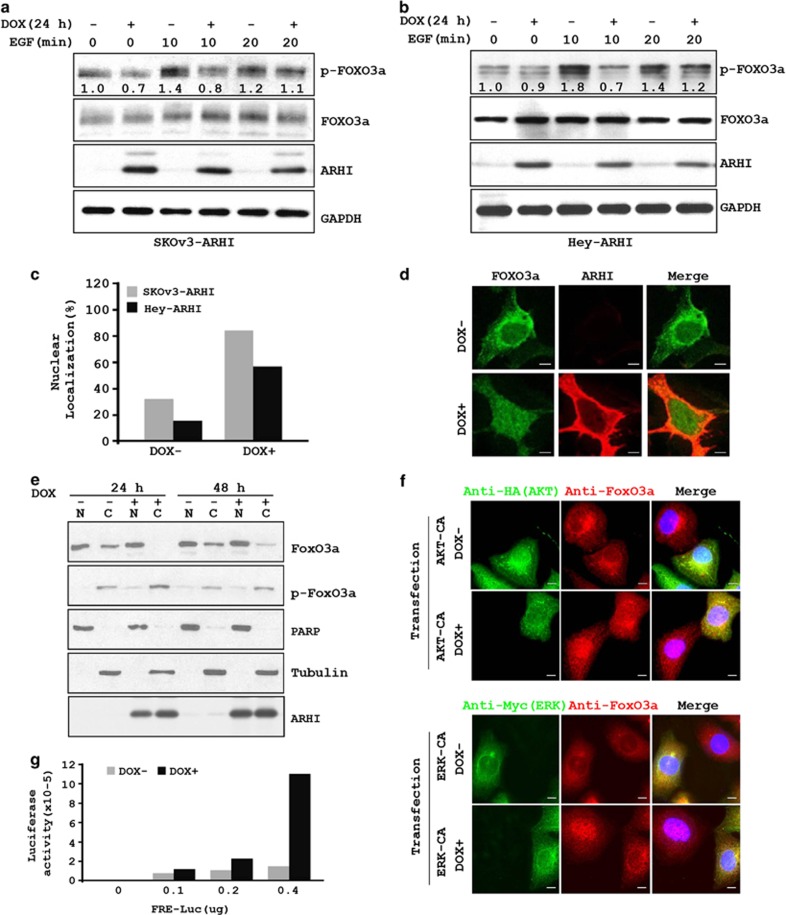
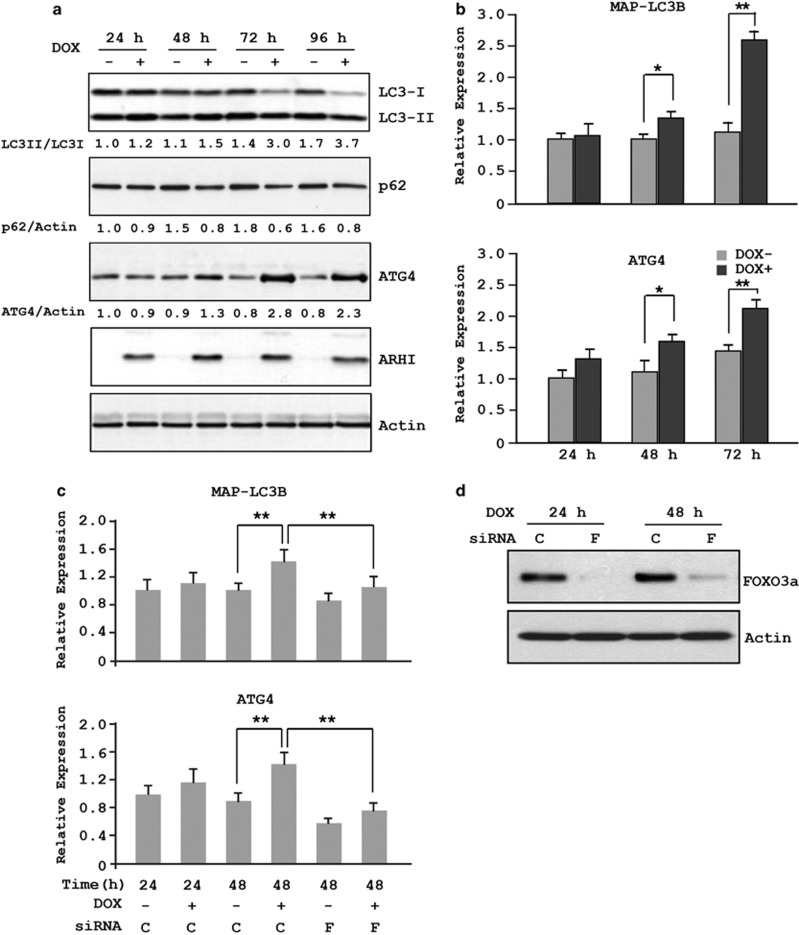
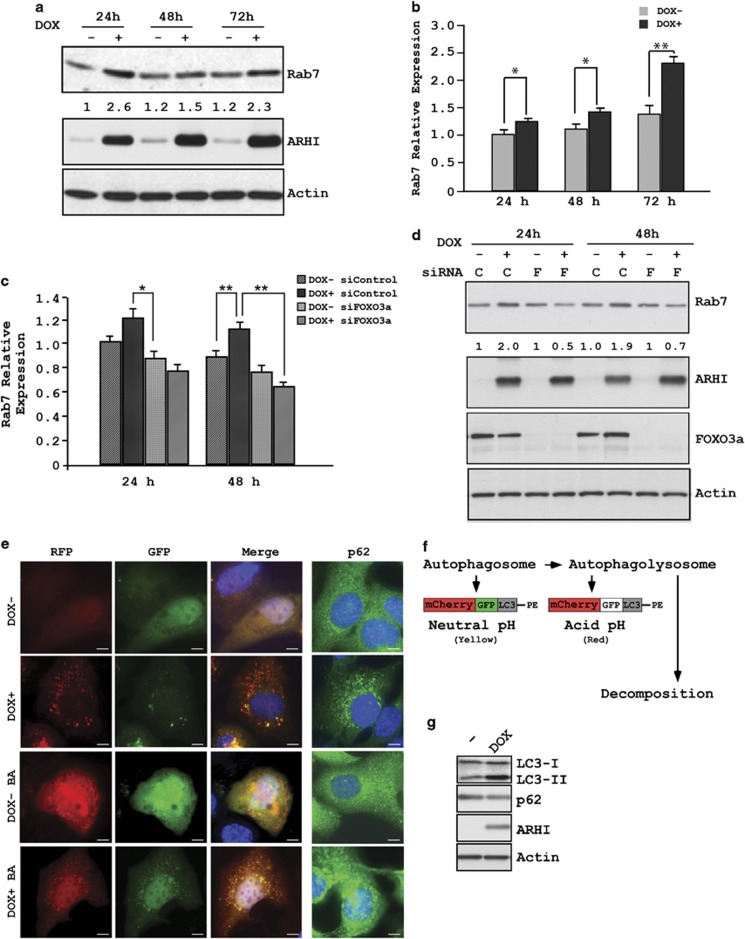
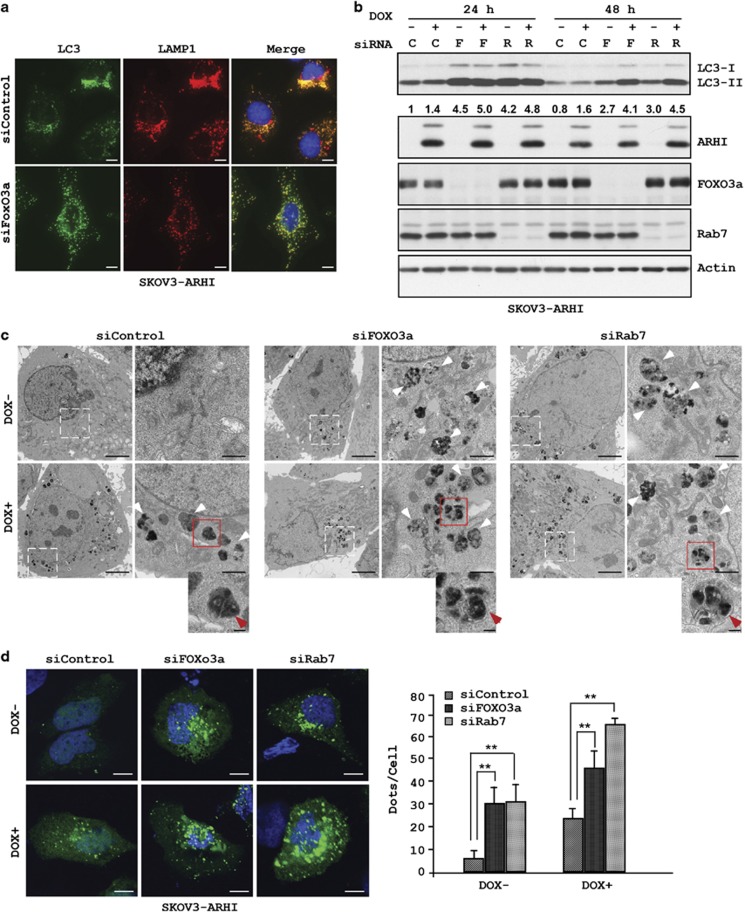
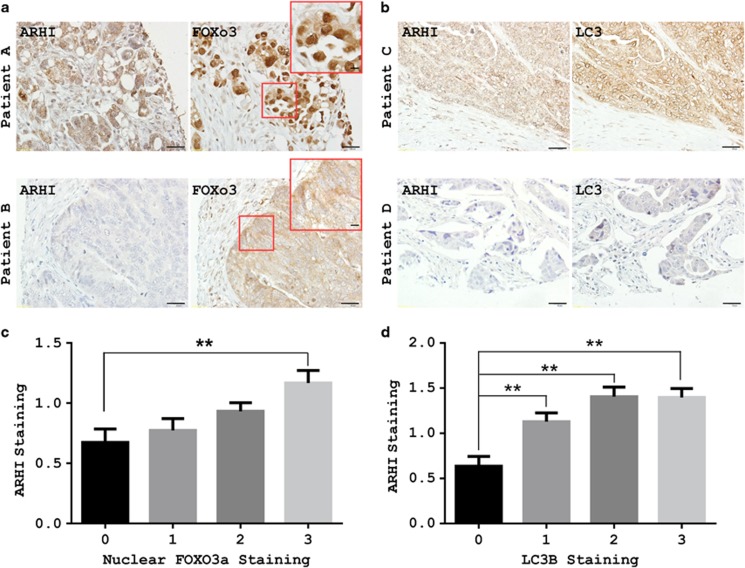
The process of autophagy has been described in detail at the molecular level in normal cells, but less is known of its regulation in cancer cells. Aplasia Ras homolog member I (ARHI; DIRAS3) is an imprinted tumor suppressor gene that is downregulated in multiple malignancies including ovarian cancer. Re-expression of ARHI slows proliferation, inhibits motility, induces autophagy and produces tumor dormancy. Our previous studies have implicated autophagy in the survival of dormant ovarian cancer cells and have shown that ARHI is required for autophagy induced by starvation or rapamycin treatment. Re-expression of ARHI in ovarian cancer cells blocks signaling through the PI3K and Ras/MAP pathways, which, in turn, downregulates mTOR and initiates autophagy. Here we show that ARHI is required for autophagy-meditated cancer cell arrest and ARHI inhibits signaling through PI3K/AKT and Ras/MAP by enhancing internalization and degradation of the epidermal growth factor receptor. ARHI-mediated downregulation of PI3K/AKT and Ras/ERK signaling also decreases phosphorylation of FOXo3a, which sequesters this transcription factor in the nucleus. Nuclear retention of FOXo3a induces ATG4 and MAP-LC3-I, required for maturation of autophagosomes, and also increases the expression of Rab7, required for fusion of autophagosomes with lysosomes. Following the knockdown of FOXo3a or Rab7, autophagolysosome formation was observed but was markedly inhibited, resulting in numerous enlarged autophagosomes. ARHI expression correlates with LC3 expression and FOXo3a nuclear localization in surgical specimens of ovarian cancer. Thus, ARHI contributes to the induction of autophagy through multiple mechanisms in ovarian cancer cells.


Figures

Figure 1
Figure 1
ARHI produces cell growth arrest and autophagy-mediated cell death. (a) Knockdown of ATG5 rescues ARHI-induced cancer cell growth inhibition. SKOv3-ARHI-shControl and SKOv3-ARHI-shATG5 ovarian cancer cells were cultured (2000 cells per well) in 96-well plates. Cells were incubated overnight, and then treated with DOX (to induce ARHI) or diluent for the indicated intervals. Cell viability was assessed using an SRB assay. Data were obtained from three independent experiments. ATG5 and LC3I/II protein levels were measured by western blot analysis. The columns indicate the mean, and the bars indicate the S.E. (**P<0.01). (b) Endogenous expression of ARHI in ovarian and breast cancer cells negatively correlates with tumor cell growth. Growth over time of four ovarian cancer cell lines (Hey, OC316, EFO21 and CaOV3) and four breast cancer cell lines (MCF-7, MB231, T47D and BT474) was plotted with the GraphPad software (La Jolla, CA, USA), and endogenous ARHI level of the cell lines were examined by western blot analysis. (c) ARHI expression positively correlates with formation of basal autophagy in the ovarian and breast cancer cells. Cells with low ARHI expression were treated with siControl, whereas cells with high ARHI expression were treated with siControl and siARHI for 48 h, fixed and then stained with anti-LC3 (red) and anti-ARHI (green). Scale bars: 10 μm
Figure 2
Figure 2
ARHI re-expression inhibits the PI3K/AKT and Ras/ERK signaling pathways. ARHI re-expression in (a) SKOv3-ARHI and (b) Hey-ARHI decreases basal and EGF-induced increases in levels of pAKT and pERK. Ovarian cancer cells were treated with DOX for 24 h to induce ARHI expression. EGF (10 ng/ml) was added for 10 or 20 min. Cell lysates were prepared and probed with the indicated antibodies by western blot analysis. Band intensities were quantified and compared with that of control untreated cells to which a value of 1.0 was assigned. (c) ARHI inhibits EGF-mediated induction of Class I PI3K activity. Cell lysates were harvested from SKOv3-ARHI cells treated with DOX (24 h) and EGF (15 min) and were immunoprecipitated with anti-p85 PI3K or IgG as control. Immune complexes were assayed for the product of PI3K activity PIP3. *P<0.05; **P<0.01. Data were obtained from two independent experiments. (d) Expression of ARHI reduces the levels of membrane-associated PIP3. SKOv3-ARHI cells were transfected with a GFP-PHAKT or a GFP-PHPLCδ reporter and cultured in the presence or absence of DOX for 24 h before they were treated with EGF (10 ng/ml for 8 min) alone or with EGF and wortmannin (100 nM for 8 min). Scale bars: 5 μm. Arrows indicate membrane accumulation of PIP3-associated GFP-PHAKT or PIP2-associated GFP-PHPLCδ. (e) Expression of ARHI reduces the levels of GTP-bound Ras. SKOv3-ARHI cells were treated with or without DOX and EGF. Active, GTP-bound Ras was pulled down with RBD-agarose beads and quantified by western blot analysis. (f) Expression of ARHI reduces the levels of membrane-associated Ras. SKOv3-ARHI cells were transfected with GFP-Ras and treated with DOX for 24 h. Cells were then fixed and GFP-Ras was detected by confocal microscopy. The arrowheads indicate the membrane localization of GFP-Ras. Scale bars: 5 μm
Figure 3
Figure 3
ARHI expression facilitates the internalization and degradation of EGFR. (a) SKOv3-ARHI and Hey-ARHI cells were treated with or without DOX and EGF. Lysates were used to determine the levels of EGFR and pEGFR. GAPDH was used as a loading control. (b) SKOv3-ARHI cells were treated with DOX for 24 h before they were treated with EGF for the indicated intervals. Left panel shows western blot blots of EGFR, GAPDH and ARHI. Right panel shows the time-dependent reduction in EGFR relative to GAPDH. (c) SKOv3-ARHI and (d) Hey-ARHI cells were treated with or without DOX and EGF for the indicated time periods. Cells were then fixed and stained with anti-EGFR antibody and visualized with confocal microscopy. Scale bars: 5 μm
Figure 4
Figure 4
ARHI expression reduces FOXo3a phosphorylation resulting in increased nuclear localization of FOXo3a. (a) SKOv3-ARHI and (b) Hey-ARHI cells were treated with DOX for 24 h before the addition of EGF for 10 or 20 min. Cell lysates were probed with anti-pFOXo3a and anti-FOXo3a antibodies. Band intensities were quantified and shown relative to that of control untreated cells to which a value of 1.0 was assigned. (c) Cells were treated with DOX for 24 h, fixed and then stained with anti-FOXo3a. Cells with nuclear staining of FOXo3a were counted and expressed as fraction of total cells counted with and without DOX. (d) Cells were treated with DOX and stained with anti-FOXo3a and anti-ARHI and visualized using confocal microscopy. Scale bars: 10 μm. (e) SKOv3-ARHI cells were treated with DOX for 24 or 48 h. Nuclear and cytoplasmic fractions were isolated and probed with antibodies against FOXo3a, pFOXo3a, tubulin and PARP. (f) ARHI-mediated FOXo3a nuclear localization is regulated by both AKT and ERK signaling. SKOv3-ARHI cells were treated with DOX and transfected with plasmid AKT-CA (Myr-HA-AKT1-DD) or ERK-CA (pCMV-myc-ERK2-L4A-MEK1-fusion) simultaneously for 24 h. Cells were then stained with anti-HA (AKT) or anti-Myc (ERK) and anti-FOXo3a antibodies and examined with confocal microscopy. Scale bars: 10 μm. (g) SKOv3-ARHI cells were transfected with an FRE-luciferase reporter and then treated with DOX to induce ARHI expression. Cell lysates were harvested 24 h later and assayed for luciferase activity
Figure 5
Figure 5
ARHI induces ATG4 and MAPLC3 expression and is mediated through FOXo3a. (a) SKOv3-ARHI cells were treated with or without DOX for the indicated intervals before cells were harvested. Cell lysates were probed with antibodies against LC3, ATG4, ARHI and actin. Band intensities were quantified and expressed relative to the untreated controls in which a value of 1.0 was assigned. (b) Cells were treated as in a and the levels of LC3B and ATG4 mRNAs were quantified by real-time RT-PCR. The columns indicate the mean, and the bars indicate the S.E. (*P<0.05; **P<0.01). Data were obtained from three independent experiments. (c) SKOv3-ARHI cells were transfected with siControl (C) or siFOXo3a (F) and treated with or without DOX. The columns indicate the mean, and the bars indicate the S.E. (**P<0.01). Data were obtained from three independent experiments. (d) Efficient knockdown of FOXo3a
Figure 6
Figure 6
ARHI expression induces Rab7 and is mediated through FOXo3a. (a) Cell lysates from SKOv3-ARHI cells were examined for Rab7 expression at indicated intervals after treatment with DOX. (b) Cells were treated as in a and the level of Rab7 mRNA was quantified by real-time RT-PCR. The columns indicate the mean, and the bars indicate the S.E. (*P<0.05; **P<0.01). Data were obtained from three independent experiments. (c) SKOv3-ARHI cells were transfected with siControl (C) or siFOXo3a (F) and treated with or without DOX. Rab7 expression was determined by RT-PCR and (d) western blot analysis. (e) ARHI expression induces autophagosome formation. SKOv3-ARHI cells were transfected with mCherry-GFP-LC3 for 24. Bafilomycin-a1 (BA, 100 nM) was added to the plate for the last 16 h of transfection. Scale bars: 10 μm. (f) A schematic diagram of mCherry-GFP-LC3 degradation. The double-tagged LC3 protein (mCherry-GFP-LC3) will emit yellow (green merged with red) fluorescence in non-acidic structures and appear as red only in the autolysosome owing to quenching of GFP in these acidic structures, (g) ARHI increase LC3-II and decreases p62. Western bot analysis of LC3 and p62 were examined
Figure 7
Figure 7
FOXo3a knockdown reduces the fusion between autophagosomes and lysosomes and leads to an accumulation of LC3. (a) SKOv3-ARHI cells were transfected with siControl or siFOXo3a for 48 h before they were fixed and stained with anti-LC3 or anti-LAMP1 antibodies. The yellow color indicates colocalization of LC3 and LAMP1. Scale bars: 10 μm. (b) Cell lysates from FOXo3a (F) and Rab7 (R) knockdown SKOV3-ARHI cells were probed for LC3 levels. Band intensities were quantified and expressed relative to the untreated controls in which a value of 1.0 was assigned. (c) Hey-ARHI cells were transfected with siControl or siFOXo3a for 24 h and then treated with or without DOX for 24 h. TEM images of autophagosomes are indicated by the white arrows. The red arrows indicate the double-layered membranes in the siFOXo3a and siRab7 cells but absent in the siControl cells. Scale bars: 0.2 μm. Higher magnification of an indicated region is shown. Scale bar: 1 μm. (d) SKOv3-ARHI cells were transfected with siControl, siFOXo3a or siRab7 for 24 h before they were transfected with GFP-LC3 and treated with or without DOX for 24 h. Cells were fixed and GFP-LC3 dots were analyzed by confocal microscopy and quantified. The columns indicate the mean, and the bars indicate the S.E. (**P<0.01). Scale bars: 10 μm. Data were obtained from two independent experiments
Figure 8
Figure 8
Correlation of ARHI, FOXo3a and LC3 in an ovarian cancer TMA. (a and b) Representative TMA images show different combinations of ARHI, FOXo3a and LC3 expression in different ovarian cancers. Patient A: Positive for ARHI, FOXo3a with dormant nuclear staining. Patient B: Negative for ARHI, FOXo3a with dormant cytoplasmic staining. Patient C: Positive ARHI with positive LC3 staining. Patient D: Negative ARHI with negative LC3 staining. Lower magnification, scale bars: 10 μm. Higher magnification (inset), scale bars: 10 μm. (c) ARHI staining correlates with FOXo3a nuclear staining. Figure was established with GraphPad Prism column analysis. (d) ARHI staining correlates with LC3 staining. Analysis is similar to c (for intensity of staining, 0: negative; 1: + 2: ++ 3: +++). The columns indicate the mean, and the bars indicate the s.e. (**P<0.01)

Similar articles

Cited by

References

    1. Cecconi F, Levine B. The role of autophagy in mammalian development: cell makeover rather than cell death. Dev Cell. 2008;15:344–357. - PMC - PubMed
    1. Melendez A, Levine B. Autophagy in C. elegans. WormBook. 2009;24:1–26. - PubMed
    1. Rosen DG, Wang L, Jain AN, Lu KH, Luo RZ, Yu Y, et al. Expression of the tumor suppressor gene ARHI in epithelial ovarian cancer is associated with increased expression of p21WAF1/CIP1 and prolonged progression-free survival. Clin Cancer Res. 2004;10:6559–6566. - PubMed
    1. Yu Y, Xu F, Peng H, Fang X, Zhao S, Li Y, et al. NOEY2 (ARHI), an imprinted putative tumor suppressor gene in ovarian and breast carcinomas. Proc Natl Acad Sci USA. 1999;96:214–219. - PMC - PubMed
    1. Luo RZ, Fang X, Marquez R, Liu SY, Mills GB, Liao WS, et al. ARHI is a Ras-related small G-protein with a novel N-terminal extension that inhibits growth of ovarian and breast cancers. Oncogene. 2003;22:2897–2909. - PubMed

Publication types

MeSH terms