. 2014 Aug;21(8):1303-12.
doi: 10.1038/cdd.2014.49. Epub 2014 Apr 25.

Degradation of Keap1 activates BH3-only proteins Bim and PUMA during hepatocyte lipoapoptosis

Affiliations

Degradation of Keap1 activates BH3-only proteins Bim and PUMA during hepatocyte lipoapoptosis

S C Cazanave et al. Cell Death Differ. 2014 Aug.

Abstract

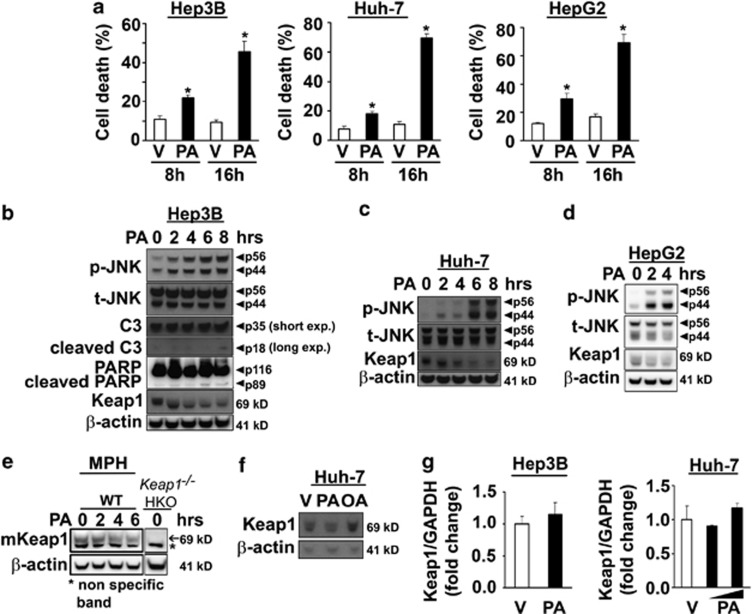
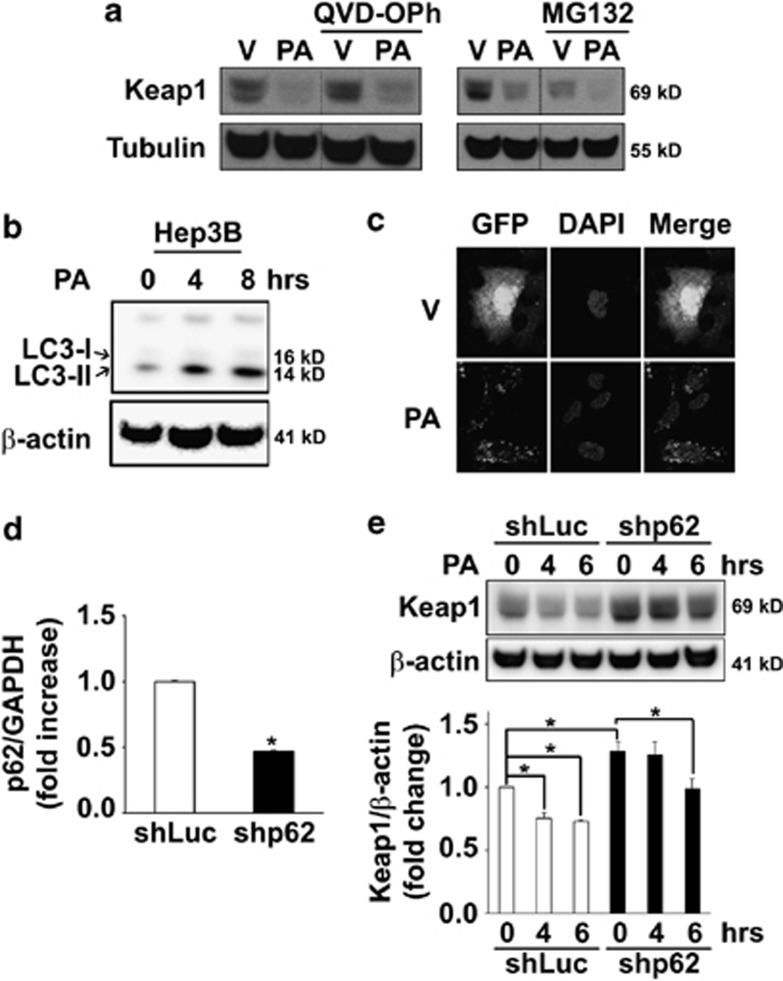
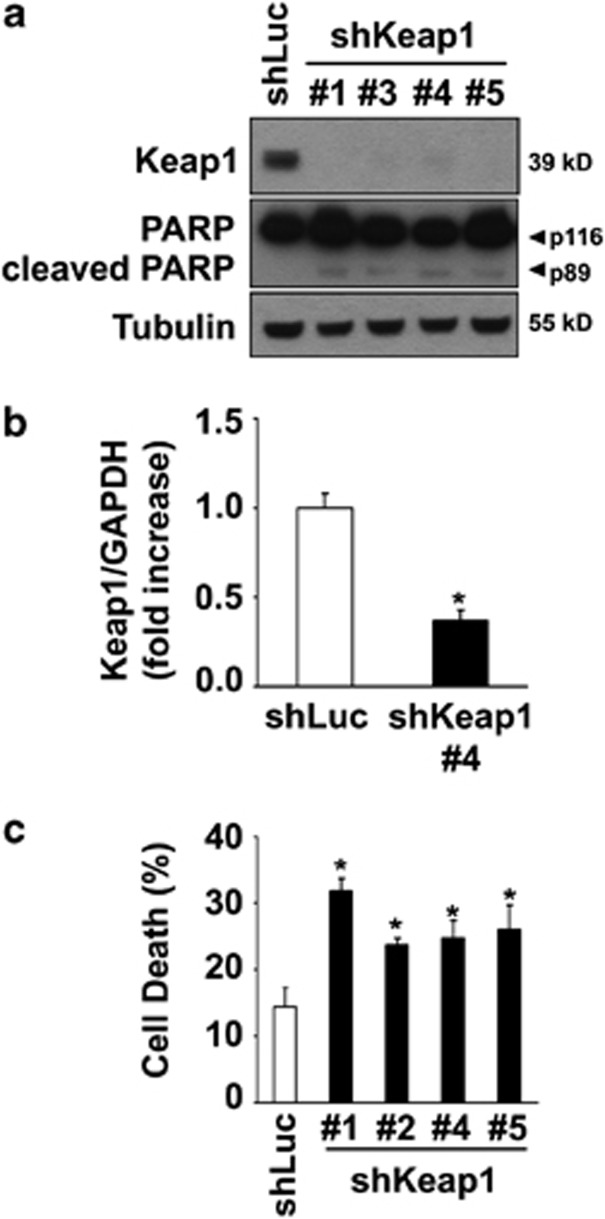
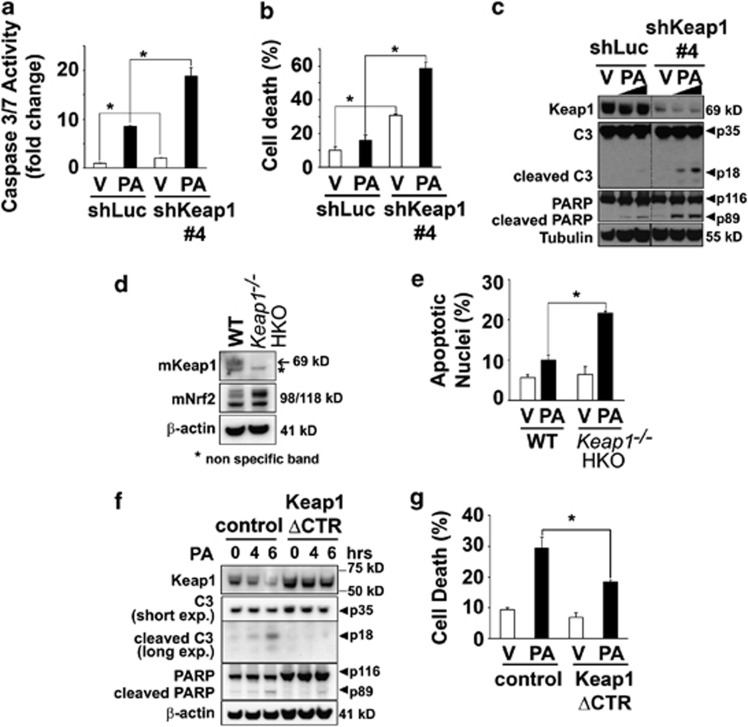
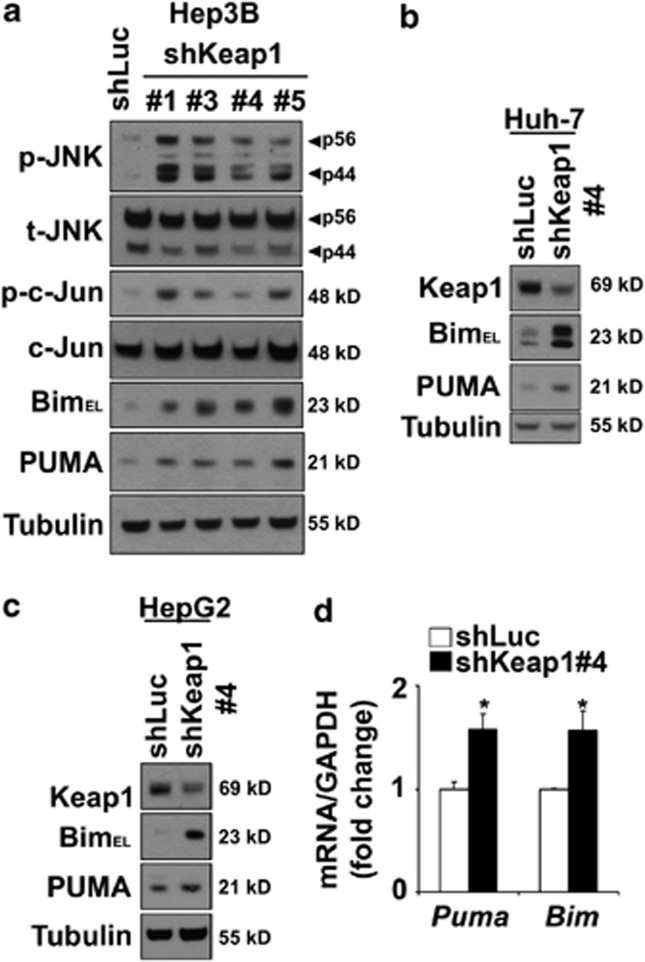
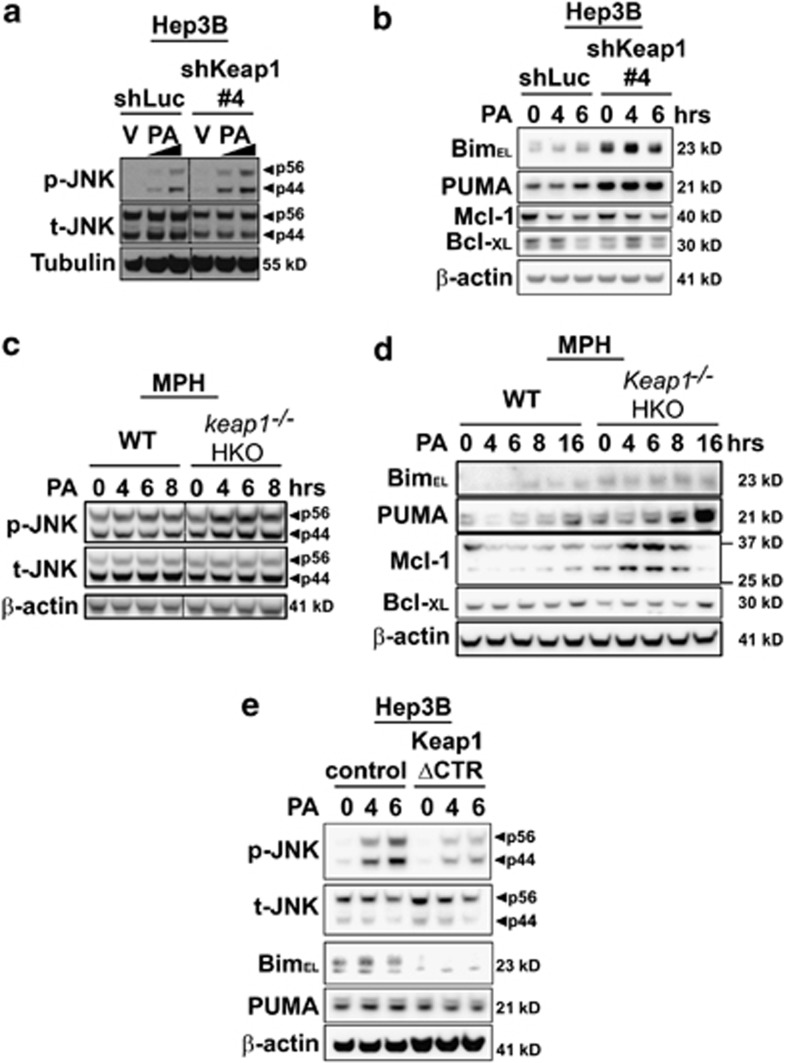
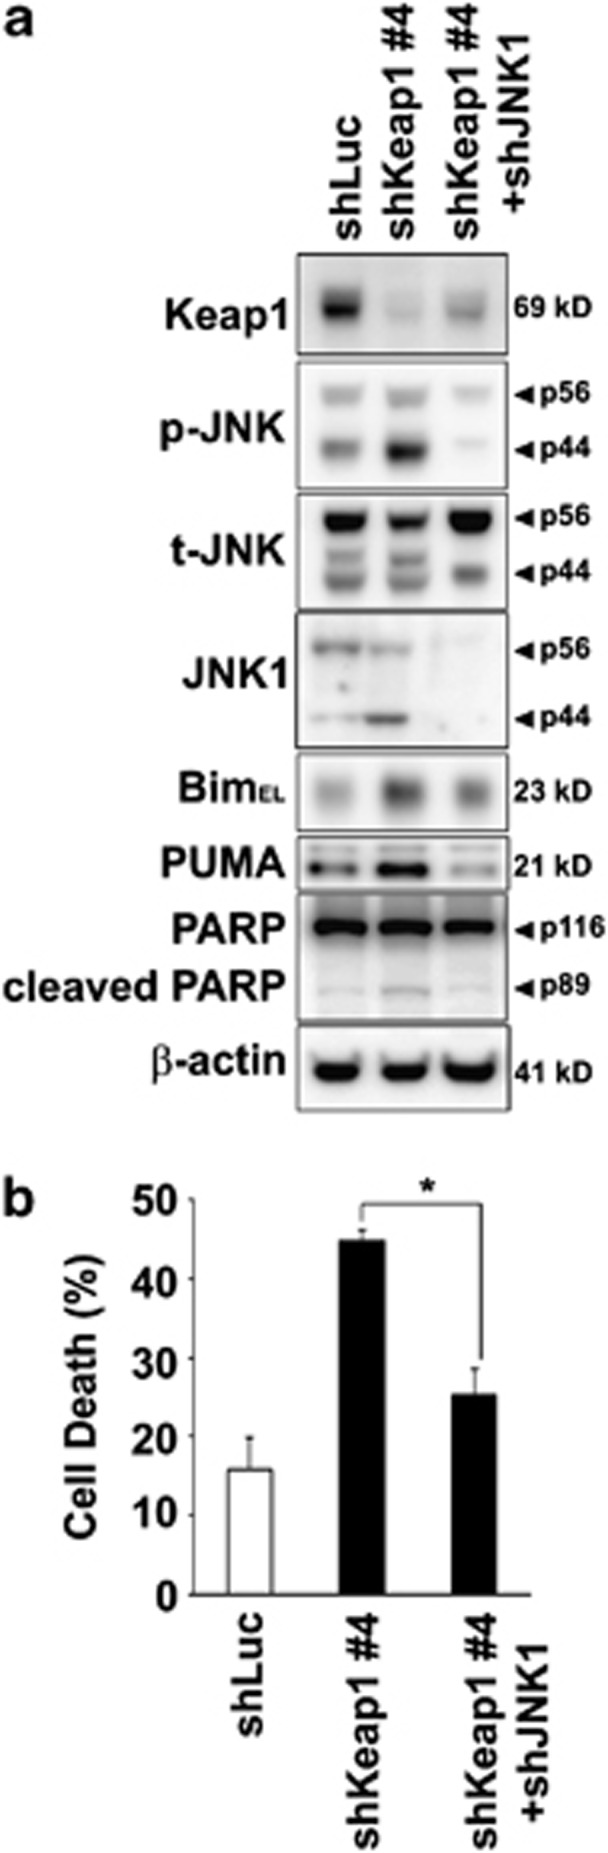
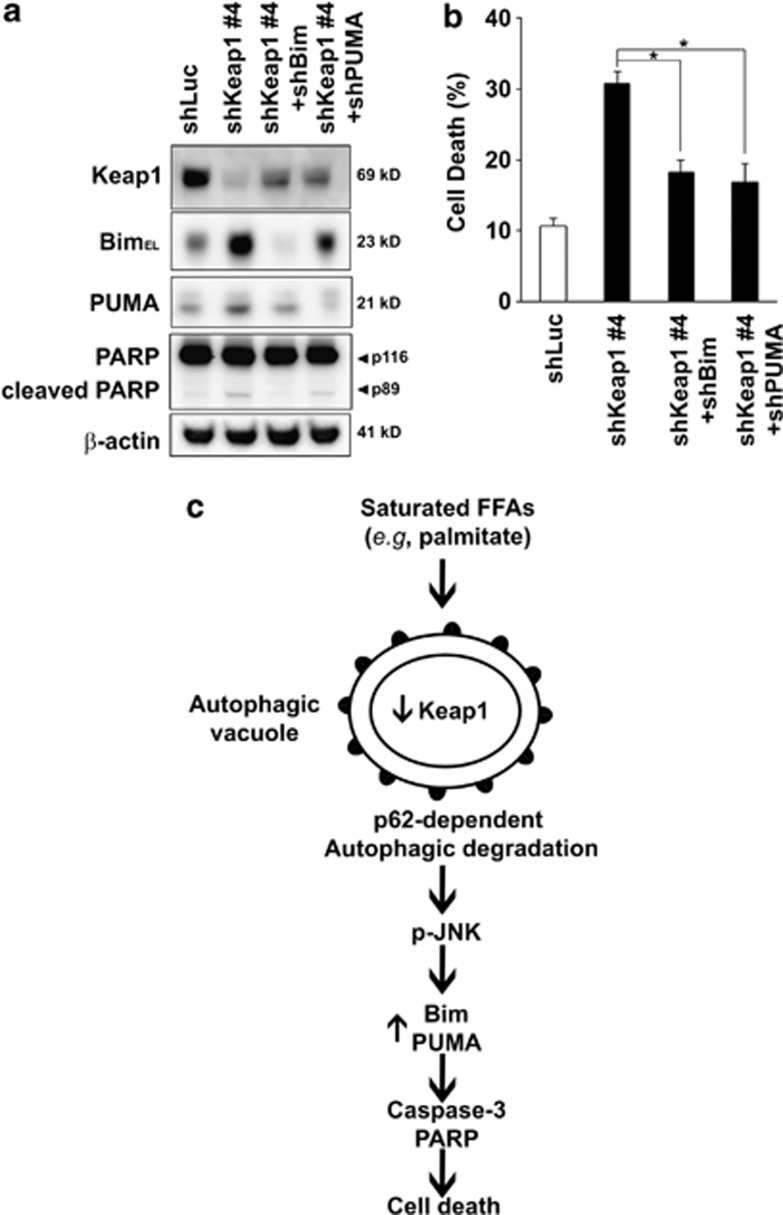
Non-alcoholic steatohepatitis is characterized by hepatic steatosis, elevated levels of circulating free fatty acids (FFA) and hepatocyte lipoapoptosis. This lipoapoptosis requires increased JNK phosphorylation and activation of the pro-apoptotic BH3-only proteins Bim and PUMA. Kelch-like ECH-associated protein (Keap)-1 is a BTB/Kelch protein that can regulate the expression of Bcl-2 protein and control apoptotic cell death. Yet, the role of Keap1 in hepatocyte lipotoxicity is unclear. Here we demonstrate that Keap1 protein was rapidly degraded in hepatocytes, through autophagy in a p62-dependent manner, in response to the toxic saturated FFA palmitate, but not following incubation with the non-toxic FFA oleic acid. Stable knockdown of Keap1 expression, using shRNA technology, in hepatocarcinoma cell lines induced spontaneous cell toxicity that was associated with JNK1-dependent upregulation of Bim and PUMA protein levels. Also, Keap1 knockdown further sensitized hepatocytes to lipoapoptosis by palmitate. Likewise, primary hepatocytes isolated from liver-specific Keap1(-/-) mice displayed higher Bim and PUMA protein levels and demonstrated increased sensitivity to palmitate-induced apoptosis than wild-type mouse hepatocytes. Finally, stable knockdown of Bim or PUMA expression prevented cell toxicity induced by loss of Keap1. These results implicate p62-dependent autophagic degradation of Keap1 by palmitate as a mechanism contributing to hepatocyte lipoapoptosis.


Figures

Figure 1
Figure 1
PA-induced toxicity correlates with cellular Keap1 protein degradation and JNK activation in liver cells. (a) Cell death was determined by trypan blue exclusion assay in Hep3B, Huh-7 and HepG2 cells treated for 8 and 16 h with PA. The concentration of PA was 400 μM for Hep3B and HepG2 cells and 600 μM for Huh-7 cells. Vehicle (V)-treated cells were used as control. Data are expressed as mean±S.E.M. for three experiments; *P<0.05. B-E, (b) Hep3B, (c) Huh-7, (d) HepG2 cells and (e) primary murine hepatocytes isolated from WT mice were incubated with PA at the indicated time points. The concentration of PA was 400 μM for Hep3B and HepG2 cells and 600 μM for Huh-7 cells and primary hepatocytes. Lysates from untreated hepatocyte specific Keap1 knockout (Keap1−/− HKO) primary mouse hepatocytes were used as a control for the specificity of Keap1 antibody (e). Whole-cell lysates were prepared and immunoblot analysis were performed for phosphorylated JNK (p-JNK), total JNK (t-JNK), caspase-3 (C3) displaying cleaved caspase-3 product p18, PARP displaying cleaved PARP product p89 and Keap1. The cleaved form of C3 was only visualized after long exposure times. β-Actin was used as a control for protein loading. (f) Whole-cell lysates were obtained from Huh-7 cells treated for 6 h with either PA (400 μM) or oleate (OA, 400 μM), and immunoblot analysis were performed for Keap1 and β-actin, a control for protein loading. (g) Total RNA was extracted from Hep3B and Huh-7 cells 6 h after treatment with PA, and vehicle (V) was used as control. The concentration of PA was 400 μM for Hep3B and 400 μM or 600 μM for Huh-7 cells. Fold induction was determined after normalization to GAPDH. Data represent the mean and error of three independent experiments
Figure 2
Figure 2
PA induces Keap1 protein degradation preferentially via p62-dependent autophagy. (a) Whole-cell lysates were prepared from Hep3B cells treated with PA (600 μM) or vehicle (V) in the presence of the pharmacological proteasome inhibitor MG132 (5 μM) or the pan-caspase inhibitor QVD-OPh (5 μM) for 6 h. Immunoblot analysis were performed for Keap1 and tubulin, a control for protein loading. Bands were cut and combined (separated by dotted line) from the same radiograph. (b) Whole-cell lysates were prepared from Hep3B cells treated with PA (400 μM) for the indicated time points. Immunoblot analysis were performed for LC3-I/II and β-actin, a control for protein loading. (c) Hep3B cells stably expressing GFP-LC3 plasmid were treated for 4 h with PA (400 μM). Vehicle (V)-treated cells were used as control. Next, cells were fixed with 4% paraformaldehyde, and GFP cellular expression was assessed by confocal microscopy. Nuclei were stained with DAPI. (d and e) Hep3B cells stably expressing shRNA targeting p62 (shp62) were treated at the indicated time points with PA at 400 μM. Luciferase shRNA-transfected cells (shLuc) were used as control in these experiments to discount any changes to the gene expression profile that may result from the shRNA delivery method or from clonal selection. (d) Effective downregulation of p62 mRNA levels in shp62 cells was verified by real-time PCR. Data are expressed as mean±S.E.M. for three experiments; *P<0.05. (e) Immunoblot analysis were performed on whole-cell lysates for Keap1 and β-actin, a control for protein loading. Keap1/β-actin ratio was calculated from four immunoblots by densitometry, *P<0.05
Figure 3
Figure 3
Keap1 knockdown induces spontaneous cell toxicity. (a) Whole-cell lysates were prepared from Hep3B cells stably expressing shRNA targeting Keap1 (shKeap1). Four shRNAs (#1, #3, #4 and #5) targeting different sequences in Keap1 mRNA were used. Luciferase shRNA-transfected cells (shLuc) were used as control. Immunoblot analysis were performed for Keap1, PARP and tubulin, a control for protein loading. (b) Effective downregulation of Keap1 mRNA levels in shKeap1#4 cells was verified by real-time PCR. (c) Cell death was determined by trypan blue exclusion assay in all four shKeap1 and shLuc Hep3B clones. Data are expressed as mean±S.E.M. for three experiments; *P<0.05
Figure 4
Figure 4
Keap1 knockdown sensitizes liver cells to PA-induced toxicity, and overexpression of Keap1 mutant (Keap1 ΔCTR) protects against lipotoxicity. (a and b) shKeap1#4 and shLuc Hep3B cells were treated with PA at 400 μM or vehicle (V) for 6 h. (a) Caspase 3/7 catalytic activity was measured using a fluorogenic assay. (b) Cell death was determined by trypan blue exclusion assay. (c) Whole-cell lysates were prepared from shKeap1#4 and shLuc Hep3B cells treated with PA at 400 or 800 μM or vehicle (V) for 6 h. Immunoblot analysis were performed for Keap1, caspase-3 (C3), PARP and tubulin, a control for protein loading. Bands were cut and combined (separated by dotted line) from the same radiograph. (d) Whole-cell lysates were prepared from WT or hepatocyte-specific Keap1 knockout (Keap1−/− HKO) primary mouse hepatocytes. Immunoblot analysis were performed for mKeap1, mNrf2 and β-actin. (e) Isolated WT or Keap1−/− HKO primary mouse hepatocytes were treated for 24 h with PA at 400 μM or vehicle, and apoptotic nuclei were counted after DAPI staining. (f) Whole-cell lysates were prepared from Hep3B cells stably transfected with Keap1 C-terminal deletion mutant (Keap1 ΔCTR) or with the control lentiviral plasmid (control) and treated at the indicated time points with PA 400 μM or vehicle. Immunoblot analysis were performed for Keap1, caspase-3 (C3), PARP and β-actin. (g) Cell death was determined by trypan blue exclusion assay in Keap1 ΔCTR or control Hep3B cells treated with PA at 400 μM or vehicle for 16 h. All data are expressed as mean±S.E.M. for three experiments; *P<0.05
Figure 5
Figure 5
Keap1 knockdown induces JNK/c-Jun signaling pathway and upregulates Bim and PUMA expression. (a–c) Whole-cell lysates were prepared from shLuc or four shKeap1 Hep3B clones (shKeap1#1,#3, #4 and #5) (a) or from shLuc or shKeap1#4 Huh-7 cells (b) or from shLuc or shKeap1#4 HepG2 cells (c), and immunoblot analysis were performed for phosphorylated JNK (p-JNK), total JNK (t-JNK), phosphorylated c-Jun (p-c-Jun), c-Jun, Bim, PUMA and tubulin, a control for protein loading. (d) Total RNA was prepared from shLuc or shKeap1#4 Hep3B. Bim and PUMA mRNA expression were quantified by real-time PCR. Fold induction is relative to internal control GAPDH. Data represent mean±S.E.M. of three experiments; *P<0.05
Figure 6
Figure 6
Cellular Keap1 protein levels regulate PA-induced JNK activation and Bim and PUMA upregulation in liver cells. (a–e), Whole-cell lysates were prepared from shLuc or shKeap1#4 Hep3B cells treated with PA at 400 and 800 μM or vehicle (V) for 6 h (a), from shLuc or shKeap1#4 Hep3B cells treated with PA at 600 μM at the indicated time point (b), from WT or hepatocyte specific Keap1 knockout (Keap1−/− HKO) primary mouse hepatocytes treated with PA at 600 μM for the indicated time points (c–d) or from Hep3B cells stably transfected with Keap1 C-terminal deletion mutant (Keap1 ΔCTR) or with the control lentiviral plasmid (control) and treated with PA 400 μM at the indicated time points (e). Immunoblot analysis were performed for phosphorylated JNK (p-JNK), total JNK (t-JNK), Bim, PUMA, Bcl-XL and Mcl-1. Tubulin or β-actin were used as a control for protein loading. Bands were cut and combined (separated by dotted line) from the same radiograph
Figure 7
Figure 7
Jnk1 knockdown reduces Bim and PUMA upregulation and liver cell toxicity induced by loss of Keap1. (a) Whole-cell lysates were prepared from Hep3B cells stably expressing shLuc, shKeap1#4 or shKeap1#4 with shJNK1 (shKeap1#4+shJNK1), and immunoblot analysis were performed for Keap1, phosphorylated JNK (p-JNK), total JNK (t-JNK), JNK1, Bim, PUMA, PARP and β-actin. (b) Cell death was determined by trypan blue exclusion assay in Hep3B cells as in panel (a). Data are expressed as mean±S.E.M. for three experiments; *P<0.05
Figure 8
Figure 8
Bim or PUMA knockdown reduces liver cell toxicity induced by loss of Keap1 and proposed model for PA-mediated Keap1 degradation-associated cell toxicity. (a) Whole-cell lysates were prepared from Hep3B cells stably expressing shLuc, shKeap1#4 or shKeap1#4 with shBim (shKeap1#4+shBim) or shKeap1#4 with shPUMA (shKeap1#4+shPUMA), and immunoblot analysis were performed for Keap1, Bim, PUMA, PARP and β-actin. (b) Cell death was determined by trypan blue exclusion assay in Hep3B cells as in panel (a). Data are expressed as mean±S.E.M. for three experiments; *P<0.05. (c) PA-mediated p62-dependent autophagic degradation of Keap1 results in activation of JNK, upregulation of Bim and PUMA, with subsequent caspase activation, PARP cleavage and cell death

Similar articles

Cited by

References

    1. Angulo P, Lindor KD. Non-alcoholic fatty liver disease. J Gastroenterol Hepatol. 2002;17 (Suppl:S186–S190. - PubMed
    1. Adams LA, Lymp JF, St, Sauver J, Sanderson SO, Lindor KD, Feldstein A, et al. The natural history of nonalcoholic fatty liver disease: a population-based cohort study. Gastroenterology. 2005;129:113–121. - PubMed
    1. Feldstein AE, Canbay A, Angulo P, Taniai M, Burgart LJ, Lindor KD, et al. Hepatocyte apoptosis and fas expression are prominent features of human nonalcoholic steatohepatitis. Gastroenterology. 2003;125:437–443. - PubMed
    1. Nehra V, Angulo P, Buchman AL, Lindor KD. Nutritional and metabolic considerations in the etiology of nonalcoholic steatohepatitis. Dig Dis Sci. 2001;46:2347–2352. - PubMed
    1. Cazanave SC, Mott JL, Elmi NA, Bronk SF, Werneburg NW, Akazawa Y, et al. JNK1-dependent PUMA expression contributes to hepatocyte lipoapoptosis. J Biol Chem. 2009;284:26591–26602. - PMC - PubMed

Publication types

MeSH terms