

Measuring large-scale social networks with high resolution
- PMID: 24770359
- PMCID: PMC4000208
- DOI: 10.1371/journal.pone.0095978
Measuring large-scale social networks with high resolution
Abstract
This paper describes the deployment of a large-scale study designed to measure human interactions across a variety of communication channels, with high temporal resolution and spanning multiple years-the Copenhagen Networks Study. Specifically, we collect data on face-to-face interactions, telecommunication, social networks, location, and background information (personality, demographics, health, politics) for a densely connected population of 1000 individuals, using state-of-the-art smartphones as social sensors. Here we provide an overview of the related work and describe the motivation and research agenda driving the study. Additionally, the paper details the data-types measured, and the technical infrastructure in terms of both backend and phone software, as well as an outline of the deployment procedures. We document the participant privacy procedures and their underlying principles. The paper is concluded with early results from data analysis, illustrating the importance of multi-channel high-resolution approach to data collection.
Conflict of interest statement
Figures
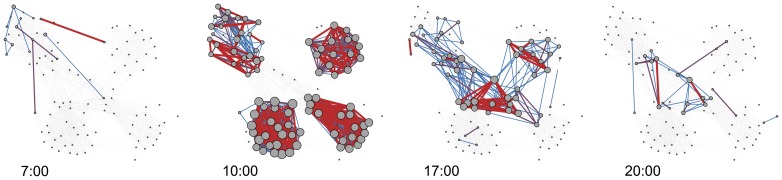
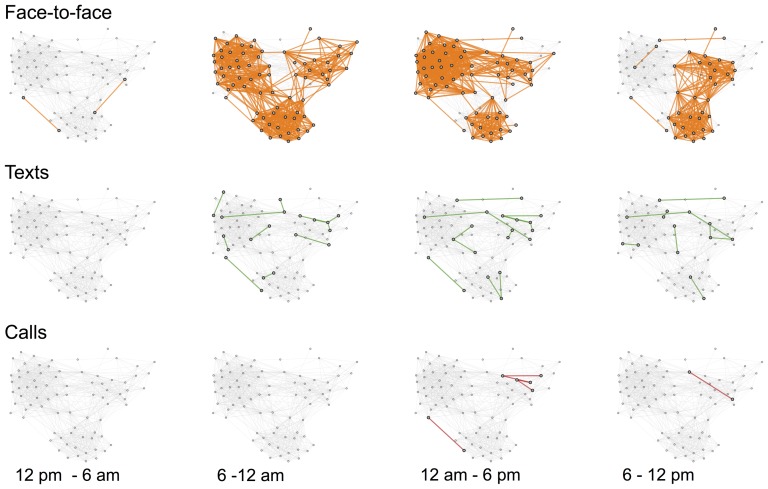
 observations
  ), purple (
 observations
  ), and red (
 observations). Node size is linearly scaled according to degree.
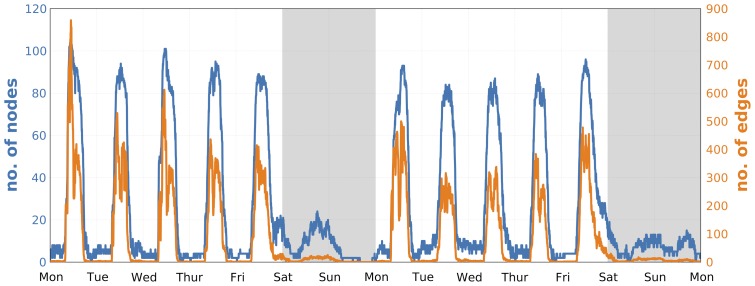
 edges and
  nodes in 5-minute time-bins and registered 10 634 unique links between participants.
 ,
,  ), whereas the similarity of the sets of nodes is fairly low (on average
  ).
).
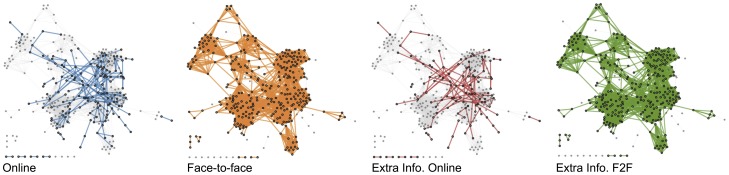
 of all traffic, are shown for clarity. Extra Info. F2F: Extra information contained in the Bluetooth data shown as the difference in the set of edges. Extra Info. Online: Additional information contained in the Facebook data.
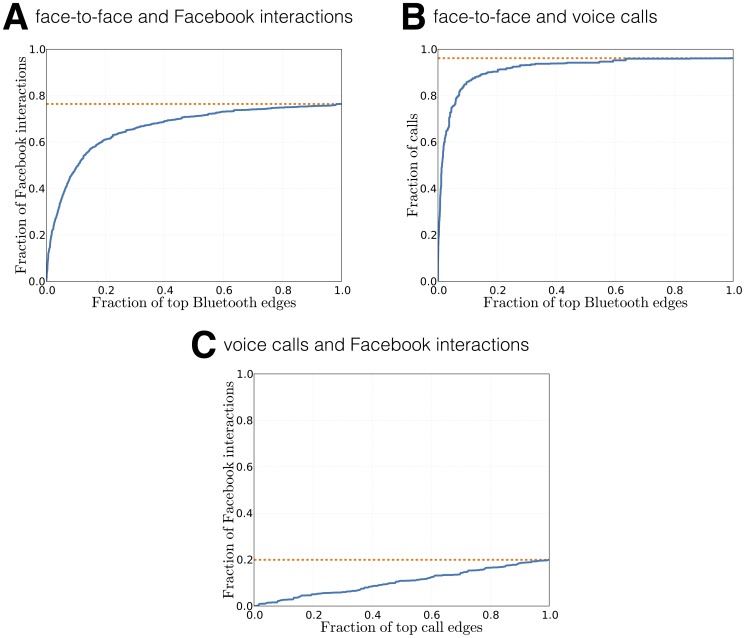
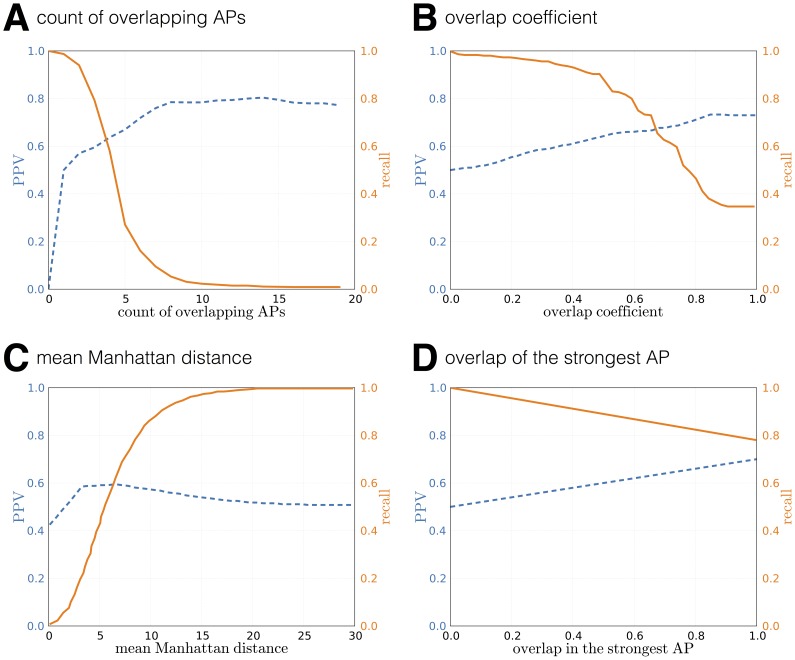
 fraction of edges from a different channel. Orange dashed line indicates the maximum fraction of ties the network accounts for. The strongest
  of face-to-face interactions account for
  of online ties and
  of call ties, while
  of Facebook ties and
  of call ties are not contained in the Bluetooth data. Between call and Facebook, the
  strongest call ties account for
  while in total
  of Facebook ties are unaccounted. All values are calculated for interactions that took place in January 2014.
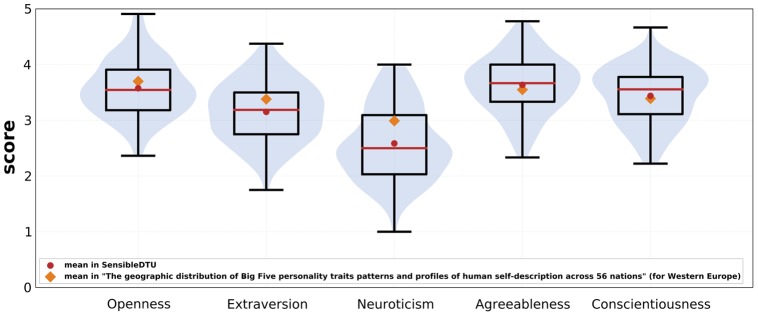
 ,
,  ; extraversion
 ,
,  ; neuroticism

 ; agreeablenes

 ; conscientiousness

 . Mean values from our deployment (red circles) compared with mean values reported for Western Europe (mixed student and general population) (orange diamonds).
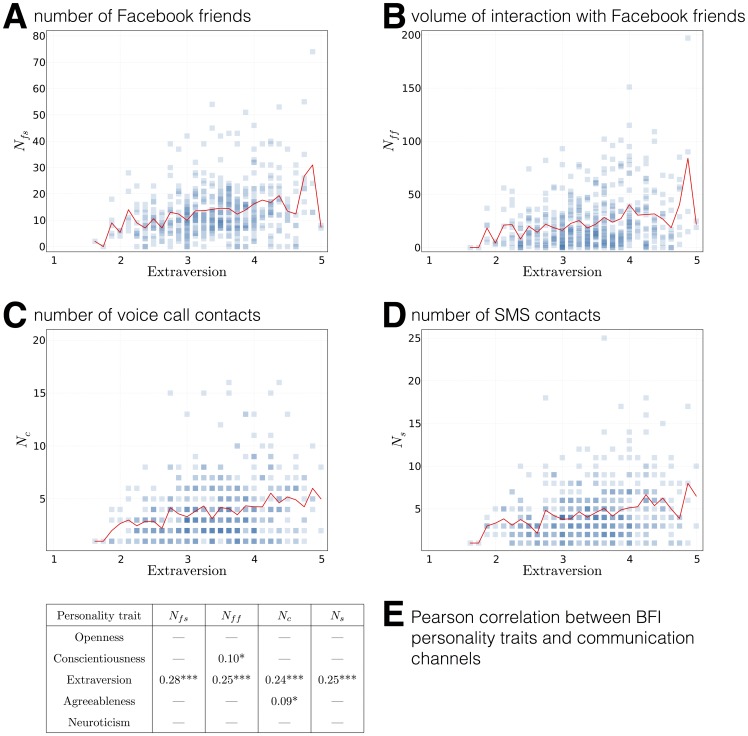
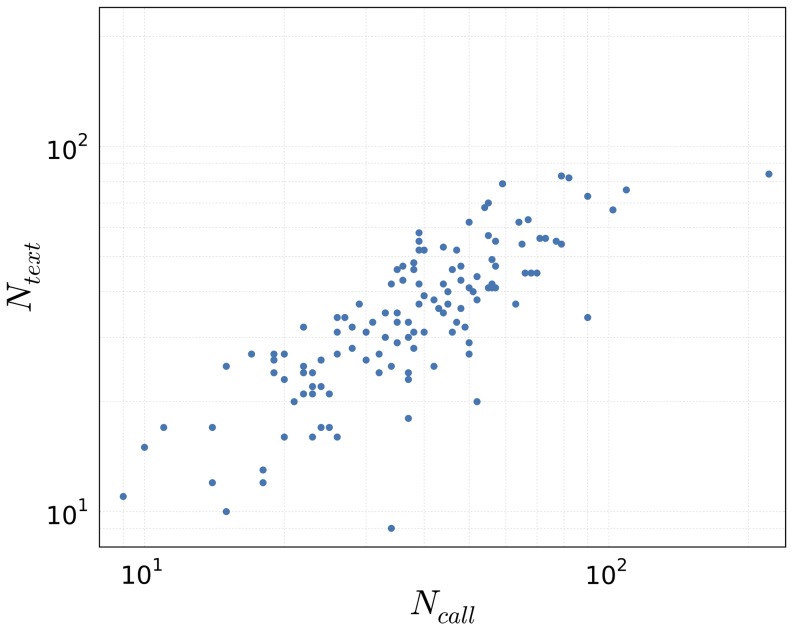
 , volume of interactions with these friends
  , number of friends contacted via voice calls
  and via SMS
  . *:
. *:  , **:
, **:  , ***:
  .
.References
-
- Ginsberg J, Mohebbi MH, Patel RS, Brammer L, Smolinski MS, et al. (2008) Detecting influenza epidemics using search engine query data. Nature 457: 1012–1014. - PubMed
-
- Aral S, Walker D (2012) Identifying influential and susceptible members of social networks. Science 337: 337–341. - PubMed
-
- Stopczynski A, Pietri R, Pentland A, Lazer D, Lehmann S (2014) Privacy in Sensor-Driven Human Data Collection: A Guide for Practitioners. arXiv preprint arXiv:14035299.
-
- Cha M, Haddadi H, Benevenuto F, Gummadi PK (2010) Measuring user influence in Twitter: The million follower fallacy. ICWSM 10: 10–17.
Publication types
MeSH terms
LinkOut - more resources
Full Text Sources
Other Literature Sources
