. 2014 Aug;62(8):1284-98.
doi: 10.1002/glia.22680. Epub 2014 Apr 25.

Fosb gene products contribute to excitotoxic microglial activation by regulating the expression of complement C5a receptors in microglia

Affiliations

Fosb gene products contribute to excitotoxic microglial activation by regulating the expression of complement C5a receptors in microglia

Hiroko Nomaru et al. Glia. 2014 Aug.

Abstract

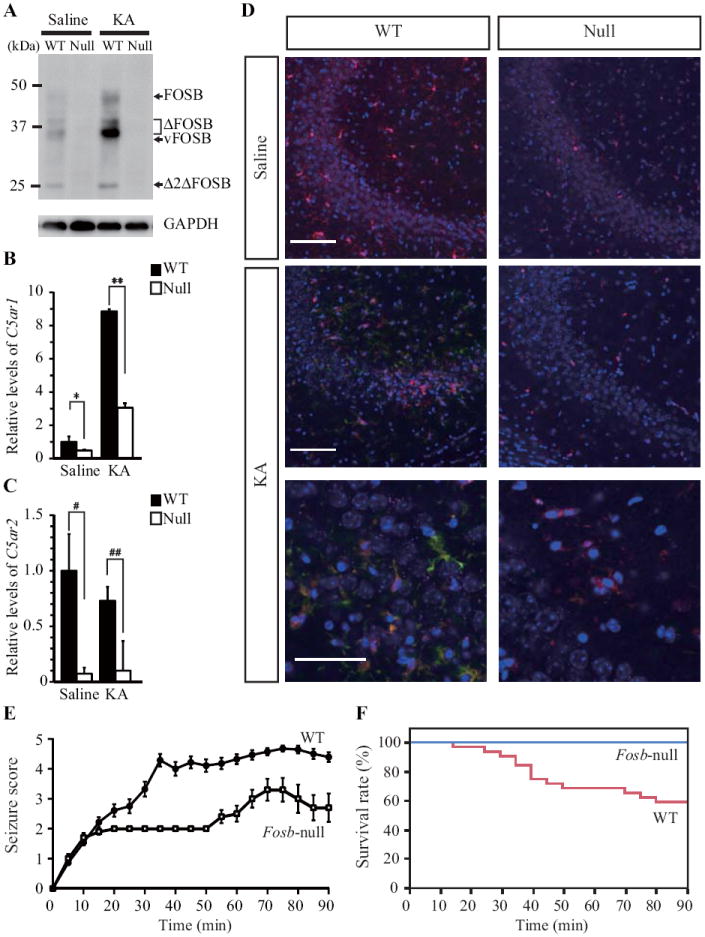
The Fosb gene encodes subunits of the activator protein-1 transcription factor complex. Two mature mRNAs, Fosb and ΔFosb, encoding full-length FOSB and ΔFOSB proteins respectively, are formed by alternative splicing of Fosb mRNA. Fosb products are expressed in several brain regions. Moreover, Fosb-null mice exhibit depressive-like behaviors and adult-onset spontaneous epilepsy, demonstrating important roles in neurological and psychiatric disorders. Study of Fosb products has focused almost exclusively on neurons; their function in glial cells remains to be explored. In this study, we found that microglia express equivalent levels of Fosb and ΔFosb mRNAs to hippocampal neurons and, using microarray analysis, we identified six microglial genes whose expression is dependent on Fosb products. Of these genes, we focused on C5ar1 and C5ar2, which encode receptors for complement C5a. In isolated Fosb-null microglia, chemotactic responsiveness toward the truncated form of C5a was significantly lower than that in wild-type cells. Fosb-null mice were significantly resistant to kainate-induced seizures compared with wild-type mice. C5ar1 mRNA levels and C5aR1 immunoreactivity were increased in wild-type hippocampus 24 hours after kainate administration; however, such induction was significantly reduced in Fosb-null hippocampus. Furthermore, microglial activation after kainate administration was significantly diminished in Fosb-null hippocampus, as shown by significant reductions in CD68 immunoreactivity, morphological change and reduced levels of Il6 and Tnf mRNAs, although no change in the number of Iba-1-positive cells was observed. These findings demonstrate that, under excitotoxicity, Fosb products contribute to a neuroinflammatory response in the hippocampus through regulation of microglial C5ar1 and C5ar2 expression.

Keywords: AP-1 transcription factors; kainic acid; neuroinflammation.


Figures

Figure 1
Figure 1
Genomic organization of the mouse Fosb gene, and its transcripts (Fosb and ΔFosb mRNAs) and translation products (FOSB, vFOSB, ΔFOSB, and Δ2ΔFOSB proteins) are shown. Yellow box; FH, N-terminal Fos homology domain; light blue box; BZIP, basic region and leucine zipper; blue box; C-TA, C-terminal transactivation domain; orange box; TBP-BD, TBP-binding domain. Each pair of dotted lines indicates the splicing of each intron and a red box indicates an “exonic intron” in exon 4, which is alternatively spliced out (red dotted lines). The black line shows primer position; primer set A (Fosb [A]) is for qPCR analysis of total Fosb mRNAs; primer set B (Fosb [B] is for RT-PCR analysis of Fosb and ΔFosb mRNAs (Table 1).
Figure 2
Figure 2
Quantitative detection of Fosb and ΔFosb mRNAs in isolated cortical microglia, astrocytes and hippocampal neurons. A. Relative expression levels of total Fosb mRNAs in wild-type microglia, neurons and astrocytes. Relative expression levels of total Fosb were estimated using microglial expression as a standard. Error bars show mean ± SEM. B. Agarose gel electrophoresis of Fosb PCR products in wild-type (WT) and Fosb-null (Null) microglia. PCR amplification results in different size fragments of Fosb (624 bp) and ΔFosb (484 bp). Control PCR reactions contain pBSKS(-)Fosb and pBSKS(-)ΔFosb plasmids (Nakabeppu and Nathans, 1991), either in combination (lane Fosb+ΔFosb) or individually (lanes Fosb and ΔFosb), and were used to amplify Fosb and ΔFosb.
Figure 3
Figure 3
Expression of C5ar1 and C5ar2 in isolated microglia, astrocytes and hippocampal neurons. A & B. Relative expression levels of C5ar1 (A) and C5ar2 (B) mRNAs in wild-type (WT) and Fosb-null (Null) microglia. Relative expression levels were estimated using the expression level in wild-type as a standard. * p < 0.0001 (Student’s t-test). Error bars show mean ± SEM. C. C5aR1 expression in cultured microglia. Cultured microglia isolated from wild-type (WT) and Fosb-null (Null) mice were subject to laser scanning confocal immunofluorescence microscopy. Blue, DAPI; green, Iba-1; red, C5aR1. Scale bar = 20 μm. D. Chemotaxis assay of wild-type (WT) and Fosb-null (Null) microglia. Number of cells moved means the number of cells traversing the porous membrane. Each experiment was independently repeated three times. Ctrl, without any chemoattractant; C5a and C5adesArg, 120, 60, or 12 ng/ml of C5a or C5adesArg, respectively; ATP, 100 μM ATP. Fosb-null microglia exhibited significantly reduced chemotaxis towards 60 ng/ml C5adesArg but not C5a or ATP, compared with wild-type * p = 0.033 (Student’s t-test). Error bars show mean ± SEM. E & F Relative expression of C5ar1 (E) and C5ar2 (F) mRNAs in microglia, neurons and astrocytes. Relative expression levels were estimated using the expression level in astrocytes as a standard. E. One way ANOVA (F2,6 = 165.13, p <0.0001, * p < 0.0001, Tukey-Kramer HSD post hoc comparison). F. One way ANOVA (F2,6 = 68.64, p <0.0001, * p = 0.0001, Tukey-Kramer HSD post hoc comparison). Error bars show mean ± SEM. To quantify the expression level of each mRNA, total RNA was reverse-transcribed to cDNA and used for qPCR analysis using appropriate primer sets (Table 1).
Figure 4
Figure 4
Fosb-dependent expression of C5ar1 and C5ar2 in mouse hippocampus. A. Western blotting of Fosb gene products. FOSB, 43 kDa; ΔFOSB, 34-37 kDa; vFOSB, 31 kDa (see Fig. 7A); Δ2ΔFOSB, 25 kDa; GAPDH protein was detected as an internal control. B & C. Expression levels of C5ar1 (B) and C5ar2 (C) mRNAs in wild-type (WT) and Fosb-null (Null) hippocampus, 24 h after saline, or kainate (KA) injection. Relative expression levels were estimated using the expression level in wild-type hippocampus treated with saline as a control. * p = 0.0059, ** p = 0.0089, # p = 0.0128, ## p < 0.0001 (Student’s t-test). Error bars show mean ± SEM. To quantify the expression level of each mRNA, total RNA was reverse-transcribed to cDNA and used for qPCR analysis using appropriate primer sets (Table 1). D. Inducible expression of C5aR1 in hippocampal CA3 region after kainate administration. Coronal sections prepared from wild-type (WT) and Fosb-null (Null) mouse brains were subjected to laser scanning confocal immunofluorescence microscopy with anti-C5aR1 and anti-Iba-1 antibodies. Nuclei were counter-stained with DAPI. Top panels: Merged images of samples 24 h after saline injection. Scale bar = 100 μm. Middle panels: Merged images of samples 24 h after kainate injection. Scale bar = 100 μm. Bottom panels: High magnification images of samples 24 h after kainate injection. Blue, DAPI; green, C5aR1; red, Iba-1. Scale bar = 50 μm. E. Seizure responses after kainate administration. Fosb-null mice exhibited significantly reduced seizure responses to kainate-induced excitotoxicity compared with wild-type mice (Generalized Linear Model, Difference; p < 0.0001, χ2=821.7, df = 39, Genotype; p < 0.0001, time; p < 0.0001, Interaction; p < 0.0001, WT N = 28, Fosb-null N = 10). Error bars show mean ± SEM. F. Survival rate after kainate administration. No Fosb-null mice died within 90 min after kainate administration (Kaplan-Meier method and log-rank test, p = 0.012, χ2 = 6.14, df = 1; WT, N = 32; Fosb-null, N = 12).
Figure 5
Figure 5
Attenuated microglial activation in Fosb-null hippocampus 24 h after kainate administration. A. Detection of activated microglia in hippocampal CA3 region 24 h after kainate injection. Coronal sections prepared from wild-type (WT) and Fosb-null (Null) mouse brains were subjected to laser scanning confocal immunofluorescence microscopy with anti-CD68 and anti-Iba-1 antibodies. Nuclei were counter-stained with DAPI. Top panels: Merged z-staked images of samples 24 h after saline injection. Bottom panels: Merged z-stacked images of samples 24 h after kainate injection. Blue, DAPI; green, CD68; red, Iba-1. Scale bars = 100 μm. B. Higher magnification images of Figure 5A. Scale bars = 50 μm. C. The percentages of double CD68 and Iba-1 positive cells in Fosb-null (Null) CA3 regions 24 h after kainate administration compared with those in wild-type (WT). Level 0 (Lv. 0); completely CD68-negative cells, Level 1 (Lv. 1); exhibiting less than six CD68-positive dots in a single cell body, Level 2 (Lv. 2); carrying more than five CD68-positive dots or homogeneous immunoreactivity in a cell body. One way ANOVA (F3,8 = 26.35 , p = 0.0002 (Lv.2), F3,8 = 25.01, p = 0.0002 (Lv.1), * p = 0.0002, ** p = 0.003, # p = 0.0003, ## p = 0.0021, Tukey-Kramer HSD post hoc comparison). D. Microglial cell body areas in Fosb-null (Null) CA3 regions 24 h after kainate administration compared with those in wild-type (WT). One way ANOVA (F3,716 = 274.38, p < 0.0001, * p < 0.0001, Tukey-Kramer HSD post hoc comparison). E. Number of microglial processes in Fosb-null (Null) CA3 regions 24 h after kainate administration, compared with those in wild-type (WT). One way ANOVA (F3,716 = 64.96, p < 0.0001, * p < 0.0001, Tukey-Kramer HSD post hoc comparison). F. Thickness of microglial processes in Fosb-null CA3 regions 24 h after kainate administration compared with those in wild-type (WT). One way ANOVA (F3,716 = 91.61, p < 0.0001, * p < 0.0001, Tukey-Kramer HSD post hoc comparison). G. Reduced expression of Il1b, Il6, and Tnf mRNAs in Fosb-null (Null) hippocampus 24 h after kainate administration, compared with wild-type (WT). Saline, 24 h after saline injection; KA, 24 h after kainate injection. Relative expression levels were estimated using the expression level in wild-type treated with saline as a control. One way ANOVA [F3,8 = 10.98, p = 0.0033, * p = 0.0426, Hsu’s multiple comparisons with best (MCB)]. One way ANOVA (F3,8 = 31.50, p < 0.0001, # p = 0.0025, Tukey-Kramer HSD post hoc comparison). Error bars show mean ± SEM. To quantify expression level of each mRNA, total RNA was reverse-transcribed to cDNA and used for qPCR analysis using appropriate primer sets (Table 1).
Figure 6
Figure 6
Density of microglial cells in the hippocampal CA3 region was similarly increased in both wild-type and Fosb-null hippocampus 24 h after kainate administration. A. The density of Iba-1 positive cells in hippocampal CA3 region. One way ANOVA (F3,16 = 7.36, p = 0.0026, * p = 0.0178, ** p = 0.023, Tukey-Kramer HSD post hoc comparison). B & C. Detection of proliferating microglia in hippocampal CA3 region 24 h after kainate injection. Coronal sections prepared from wild-type (WT) (B) and Fosb-null (Null) (C) mouse brains were subjected to laser scanning confocal immunofluorescence microscopy with anti-Ki67 and anti-Iba-1 antibodies. Nuclei were counter-stained with DAPI. Blue, DAPI; green, Ki67; red, Iba-1. Scale bars = 50 μm.
Figure 7
Figure 7
Reduced expression of C5ar1 and C5ar2 mRNAs in microglia isolated from several lines of Fosb mutant mice. A. Western blotting of Fosb gene products in wild-type (WT), Fosb-null (Null), FosbF/F (F/F), and Fosbd/d (d/d) hippocampus. FOSB, 43 kDa; ΔFOSB, 34-37 kDa; Δ2ΔFOSB, 25 kDa. vFOSB (31 kDa) was only detected in FosbF/F hippocampus. GAPDH protein was detected as an internal control. B. Expression levels of C5ar1 and C5ar2 mRNAs in wild-type (WT), Fosb-null (Null), FosbF/F (F/F) and Fosbd/d (d/d) microglial cells. Relative expression levels were estimated using the expression level in wild-type as a control. One way ANOVA (F3,8 = 14.60, p = 0.0013 (C5ar1), F3,8 = 98.10, p < 0.0001 (C5ar2), * p = 0.0026, ** p = 0.002, *** p = 0.0051, # p < 0.0001, Tukey-Kramer HSD post hoc comparison). Error bars show mean ± SEM. To quantify the expression level of each mRNA, total RNA was reverse-transcribed to cDNA and used for qPCR analysis using appropriate primer sets (Table 1).

Similar articles

Cited by

References

    1. Ager RR, Fonseca MI, Chu SH, Sanderson SD, Taylor SM, Woodruff TM, Tenner AJ. Microglial C5aR (CD88) expression correlates with amyloid-ß deposition in murine models of Alzheimer’ disease. J Neurochem. 2010;113:389–401. - PMC - PubMed
    1. Anisman H, Hayley S. Inflammatory factors contribute to depression and its comorbid conditions. Sci Signal. 2012;5:pe45. - PubMed
    1. Bamberg CE, Mackay CR, Lee H, Zahra D, Jackson J, Lim YS, Whitfeld PL, Craig S, Corsini E, Lu B, Gerard C, Gerard NP. The C5a receptor (C5aR) C5L2 is a modulator of C5aR-mediated signal transduction. J Biol Chem. 2010;285:7633–7644. - PMC - PubMed
    1. Bibb JA, Chen J, Taylor JR, Svenningsson P, Nishi A, Snyder GL, Yan Z, Sagawa ZK, Ouimet CC, Nairn AC, Nestler EJ, Greengard P. Effects of chronic exposure to cocaine are regulated by the neuronal protein Cdk5. Nature. 2001;410:376–380. - PubMed
    1. Block ML, Hong JS. Microglia and inflammation-mediated neurodegeneration: multiple triggers with a common mechanism. Prog Neurobiol. 2005;76:77–98. - PubMed

Publication types

MeSH terms